ODYSSEUS: Building an Agentic Pentest Platform
How I built a multi-stage agentic pentest pipeline, what it found and missed, and how to use the approach in your workflows
Disclaimer: This post is for educational purposes and authorized security testing only. Only use these techniques against systems you own or have explicit permission to assess, and do not violate laws, contracts, or terms of service.
Table of Contents
- Introduction
- From Ralph Loops to Claude Code Tasks
- Platform Overview
- Architecture
- The Claude Runner
- The Pipeline: Stage by Stage
- Agent Activity and Observability
- Results
- Takeaways
- Closing Notes
Introduction
In my previous post, I adapted the Ralph Wiggum autonomous agent pattern for penetration testing. That was a bash loop feeding prompts to Claude Code, with two stages: static code review and dynamic exploit validation. It worked, but it was duct tape and shell scripts. The state lived in JSON files that the loop managed. The orchestration was a while true in bash. Signal detection was regex over stdout.
After that experiment, I wanted to see what it would look like to build this properly—a platform with a UI, a pipeline that tracks state in a database, real-time observability into what the agents are doing, and structured output validation at every stage. The result is ODYSSEUS.
The target is the same—OWASP Juice Shop—and the same caveat from the Ralph post applies: Claude was almost certainly trained on Juice Shop, so any results need to be taken with that grain of salt. The point of this project wasn’t to prove the agent can find zero-days; it was to explore what a structured agentic security workflow looks like when you move past bash loops.
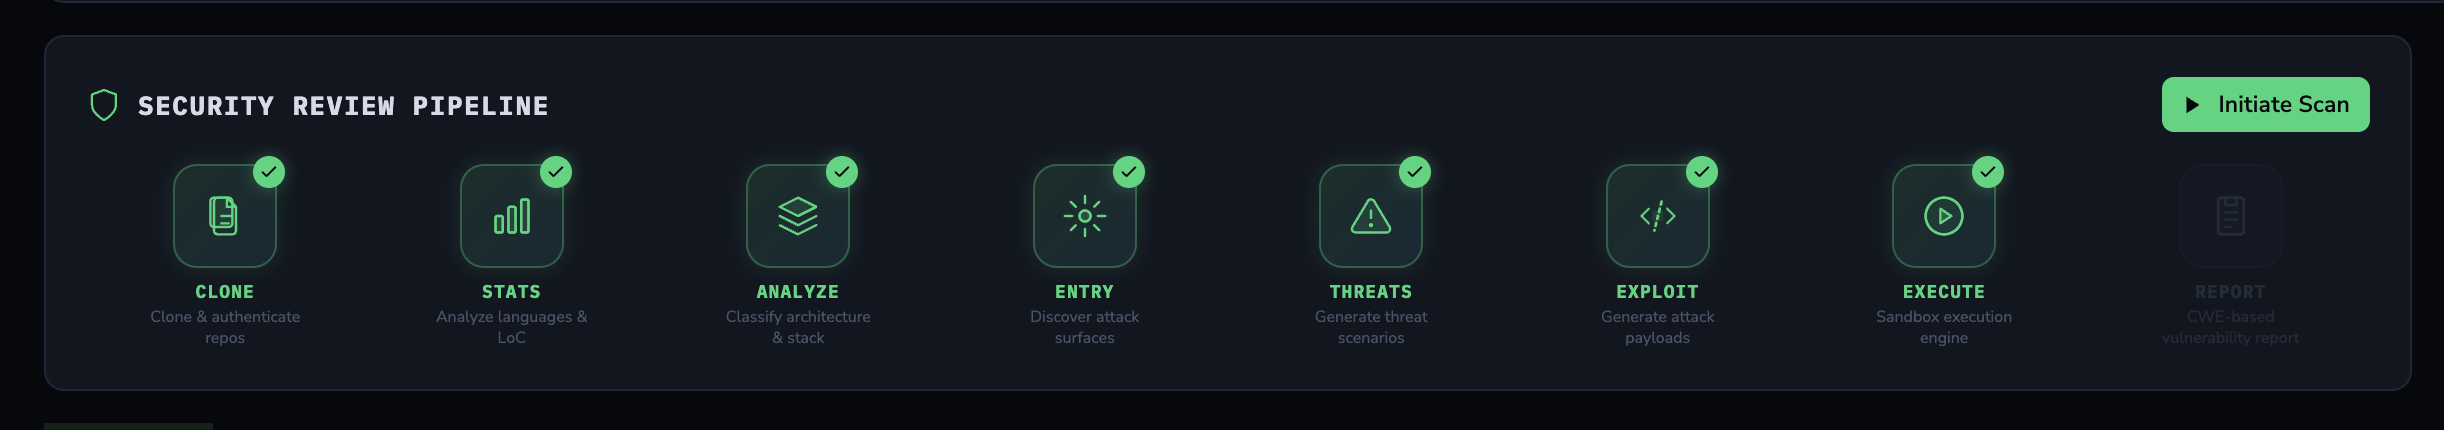 The seven-stage security review pipeline
From Ralph Loops to Claude Code Tasks
The original Ralph Wiggum pattern is intentionally simple: an external bash while true keeps re-prompting Claude Code in --print mode, and progress is carried forward through changes in the repo and generated artifacts. Anthropic liked that approach enough to ship an official Ralph Wiggum plugin in the Claude Code repository.
Claude Code also provides a more structured path. It includes built-in task tools—TaskCreate, TaskUpdate, TaskList, and TaskGet—for tracking work items and dependencies, plus the Task tool for spawning subagents in separate contexts. Agent Teams extends that into multiple Claude Code sessions sharing a task list with direct peer messaging.
Ralph and Tasks/Teams are trying to achieve similar outcomes: sustained multi-step agent work. The key difference is structure: Ralph is basically a while loop around Claude, while Tasks/Teams add explicit task tracking and coordination. They can be combined.
ODYSSEUS uses the Task tool. The backend invokes Claude Code as a subprocess for each pipeline stage and manages state in a database. Within each invocation, agents parallelize work—spawning subtasks to scan different parts of the codebase simultaneously. The pipeline orchestration is deterministic (backend code controls stage sequencing), but each stage’s analysis is agentic (Claude decides how to explore the codebase and when to parallelize).
Platform Overview
You create an engagement, point it at a repository, and ODYSSEUS runs a multi-stage sequence of AI agents—each producing structured output that feeds the next stage.
It starts where any security tool should: behind a login.
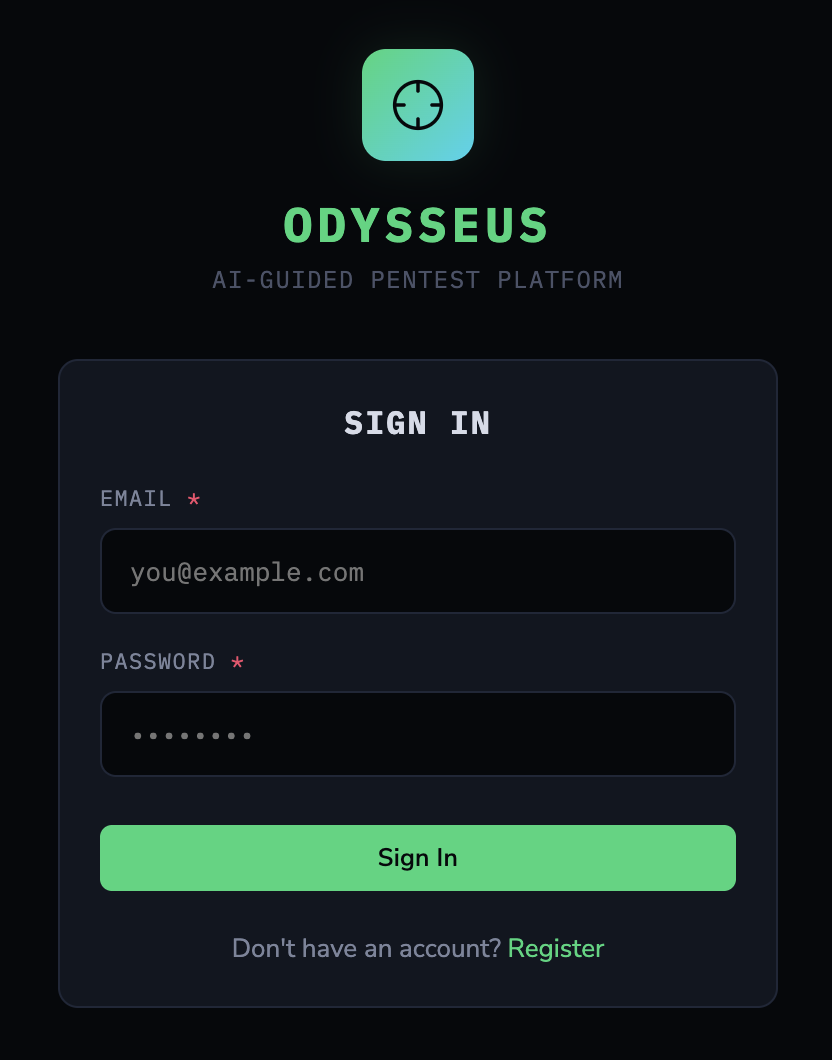 ODYSSEUS login screen
After authentication, you create an engagement by providing a repository URL (or local path) and optionally a target domain for live exploit verification.
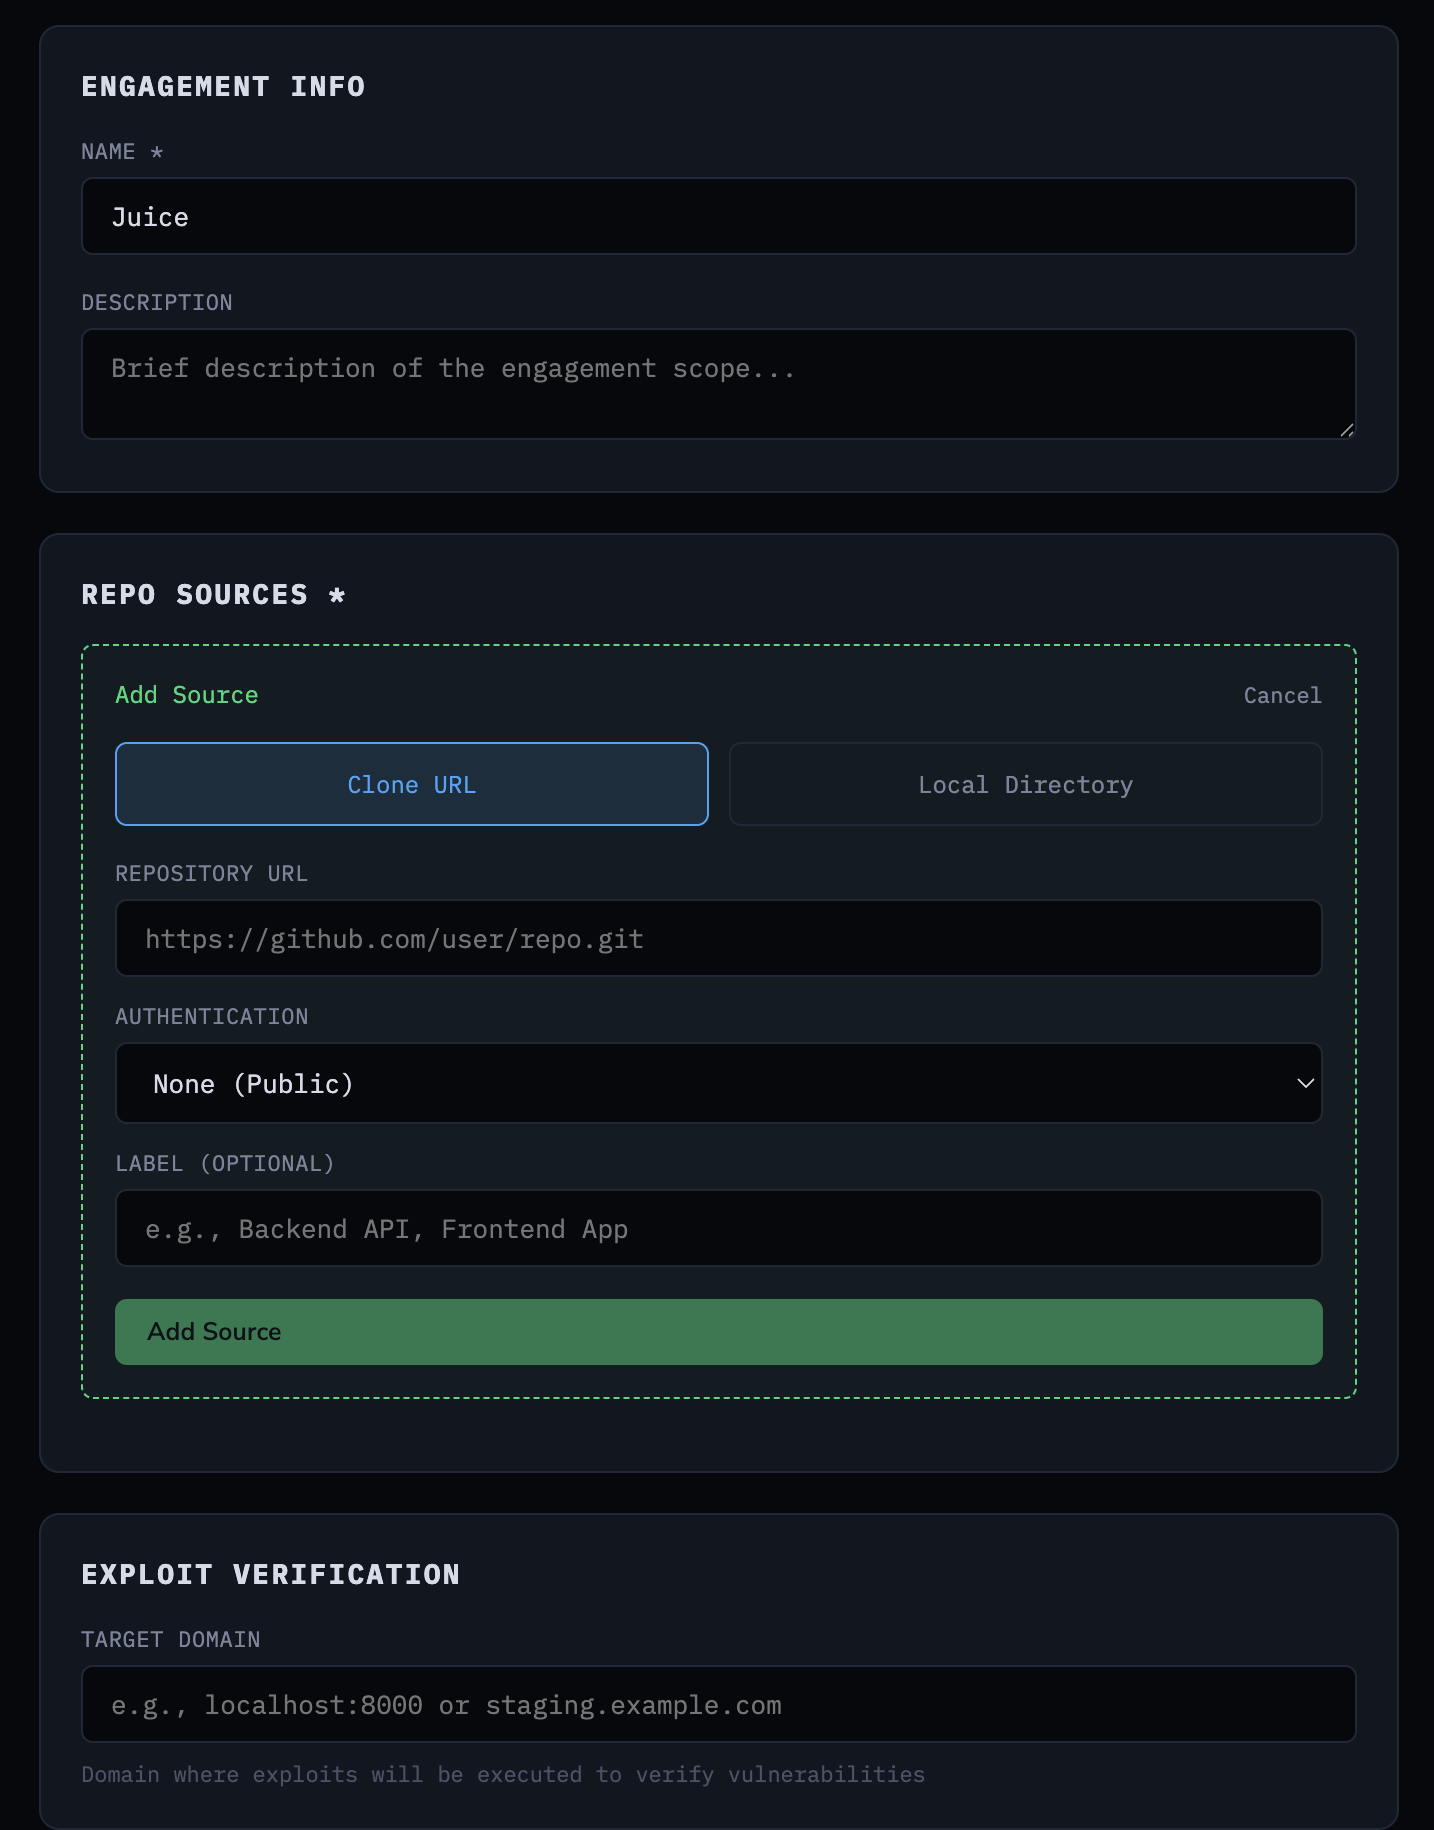 Creating an engagement with repository source and target domain
The pipeline then runs seven stages: clone the repository, analyze code statistics, run a repo analyzer agent, find entry points, build a threat model, generate exploits, and execute those exploits against the live target. Each stage’s output is stored in PostgreSQL and available through the UI as the pipeline progresses.
 Pipeline stage execution triggered from the UI
Architecture
The platform runs as five Docker services:
1
2
3
4
5
6
services:
  db:           # PostgreSQL 16 - engagement state, exploits, results
  redis:        # Redis 7 - session management
  backend:      # FastAPI - pipeline orchestration, API, WebSocket
  claude-sandbox:  # Claude Code CLI in an isolated container
  frontend:     # React + Vite - pipeline UI, real-time activity
The FastAPI backend exposes a REST API under /api/v1:
1
2
3
4
5
6
7
8
9
10
11
/auth          POST register, login, refresh, logout | GET me
/engagements   CRUD engagements and repo sources
/engagements   Pipeline stages: clone, analyze, analyze-repo,
               find-entry-points, analyze-threats,
               generate-exploits, execute-exploits
               Results: stats, entry-points, threat-model,
               exploits, activity
/configs       CRUD engagement configurations
/settings      Claude auth status, verify, configure
/filesystem    Browse host directories for repo selection
WS /engagements/{id}/activity/ws   Real-time pipeline streaming
We use JWTs—all protected routes expect a Bearer token, and the WebSocket endpoint validates the JWT via a query parameter before upgrading the connection - sensitive data in a URL parameter, huh…. You’d be surprised how many agentic “pentest/red team” tools on GitHub ship with completely unauthenticated APIs.
The key design decision is the claude-sandbox container. The backend runs Claude Code CLI as a subprocess inside a dedicated Docker container. This is a development convenience—Claude Code CLI gives you tool use, file access, and agentic behavior out of the box without building that orchestration yourself. In a production or commercial context, you’d use the Anthropic API directly with proper tool definitions, rate limiting, and cost controls. The backend talks to the sandbox via docker exec:
1
2
3
4
5
6
7
8
claude-sandbox:
  environment:
    CLAUDE_CODE_OAUTH_TOKEN: ${CLAUDE_API_KEY:-}
  volumes:
    - /Users:/workspace/host:ro  # Read-only access to host repos
    - claude_config_v2:/home/vscode/.claude
  security_opt:
    - no-new-privileges:true
The Dockerfile also bakes in a bypassPermissions setting so Claude Code runs non-interactively as a subprocess, with tools like Bash, Read, Glob, and Grep available without interactive prompts:
1
{"permissions":{"defaultMode":"bypassPermissions"}}
The sandbox mounts the host filesystem as read-only at /workspace/host, so Claude can read repository code but can’t modify it. The no-new-privileges security option prevents privilege escalation inside the container.
The sandbox also ships with agent-browser from Vercel Labs—a Playwright-based headless browser CLI. This is not the Claude in Chrome extension from the Ralph post; it’s a standalone tool that runs inside the container with its own Chromium install. The Dockerfile installs it alongside Playwright and downloads the Claude Code skill definition so the agent knows how to use it:
1
2
3
4
5
RUN npm install -g agent-browser @playwright/test && \
    npx playwright install-deps chromium && \
    npx playwright install chromium && \
    curl -fsSL https://raw.githubusercontent.com/vercel-labs/agent-browser/main/skills/agent-browser/SKILL.md \
      -o /home/vscode/.claude/skills/agent-browser/SKILL.md
This matters for the exploit runner stage—the agent can drive a headless browser to interact with the target application, fill forms, click buttons, and capture snapshots, all from within the sandboxed container.
The backend mounts the Docker socket so it can docker exec into the sandbox:
1
2
3
4
backend:
  volumes:
    - /var/run/docker.sock:/var/run/docker.sock
    - /Users:/Users:ro
Path mapping translates between host and container paths. A repository at /Users/you/repos/juice-shop becomes /workspace/host/you/repos/juice-shop inside the sandbox. The ClaudeRunner handles this transparently.
The Claude Runner
The ClaudeRunner is the core abstraction. Every agent stage calls it with a prompt, a working directory, and a Pydantic schema for output validation. It handles container execution, stream parsing, activity tracking, and JSON extraction.
1
2
3
4
5
6
7
8
9
10
11
12
13
14
class ClaudeRunner:
    async def run_analysis(
        self,
        prompt: str,
        working_dir: str | Path,
        schema: Type[T],
        tracker: ActivityTracker | None = None,
        engagement_id: Any | None = None,
    ) -> T:
        container_workdir = self._map_path_to_container(working_dir)
        cmd, stdin_prompt = self._build_docker_command(prompt, container_workdir)
        output = await self._execute_command(cmd, stdin_input=stdin_prompt, ...)
        result = self._parse_output(output, schema, tracker)
        return result
The command it builds is deliberately minimal:
1
2
3
4
claude_cmd = (
    f"cd '{workdir}' && "
    f"claude --print --output-format stream-json --verbose"
)
That’s it. No --allowedTools restrictions, no tool filters, no explicit instructions about which tools to use. With no tool allowlist or filters here, the agent can choose its own analysis strategy using the available tools. The --output-format stream-json flag gives us structured streaming events so we can track activity in real-time. The --verbose flag includes tool call details in the stream.
The prompts tell Claude what to produce (a JSON schema to fill) and what to look for (entry points, vulnerabilities, exploits), but not how to explore the codebase. The agent figures out which files to read, which patterns to grep for, whether to use the Task tool for parallelization, and when it has enough information to produce the output. Being too prescriptive about the exploration strategy defeats the purpose—you want the model’s reasoning about where to look and what matters, not just its ability to follow a script.
The prompt is piped via stdin so prompt content isn’t passed as command-line arguments (which avoids argument-quoting issues), though shell safety still depends on how the command string is built:
1
2
3
4
5
6
7
8
9
10
11
12
process = await asyncio.create_subprocess_exec(
    *cmd,
    stdin=asyncio.subprocess.PIPE,
    stdout=asyncio.subprocess.PIPE,
    stderr=asyncio.subprocess.PIPE,
    limit=10 * 1024 * 1024,  # 10MB buffer for long JSON lines
)

if stdin_input and process.stdin:
    process.stdin.write(stdin_input.encode("utf-8"))
    await process.stdin.drain()
    process.stdin.close()
Output parsing tries multiple candidates. Claude’s stream-json format includes {"type":"result","result":"..."} events and assistant message text blocks. The parser collects all candidates that contain JSON, tries each one against the schema, and prefers the one containing the expected top-level key:
1
2
3
4
5
6
7
8
9
10
candidates = []
if result_text:
    candidates.append(result_text)
candidates.extend(reversed(assistant_texts))

for candidate in candidates:
    parsed = extract_json(candidate, required_key=required_key)
    if parsed and required_key in parsed:
        data = parsed
        break
Claude doesn’t always put the JSON in the final message. Sometimes it’s in an earlier text block, sometimes it’s in the result event, sometimes the model adds commentary after the JSON. Trying multiple candidates in priority order handles all of these cases.
The Pipeline: Stage by Stage
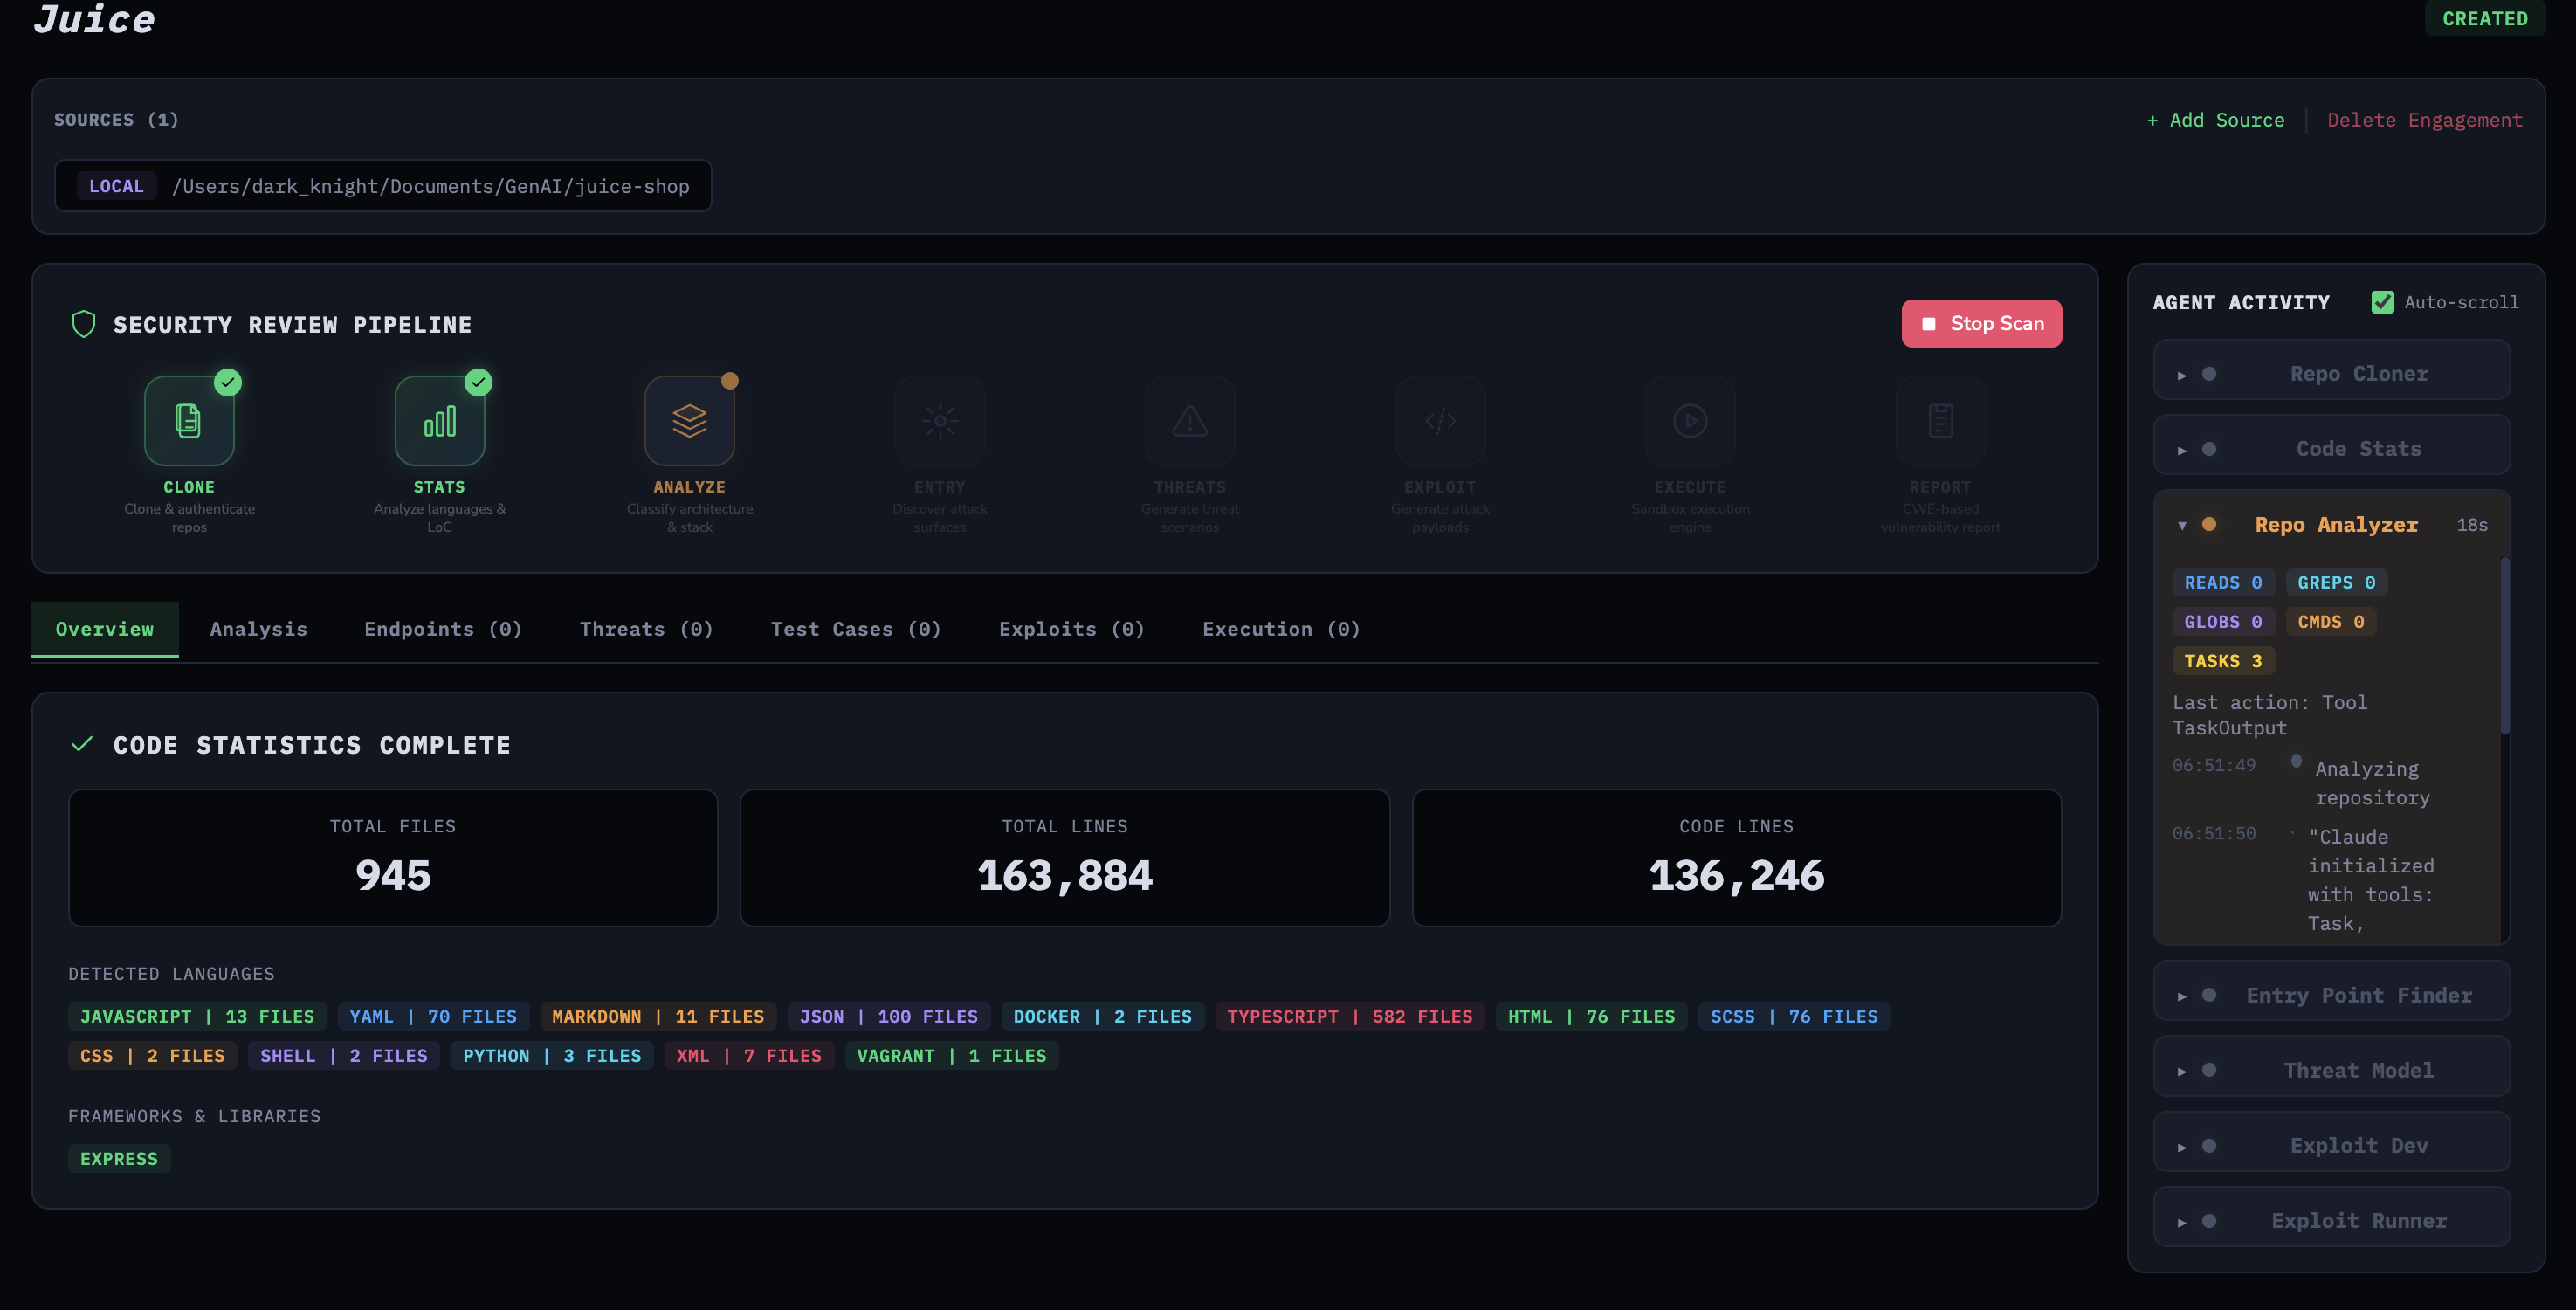
Stage 1-2: Clone and Code Statistics
Nothing agentic here. The platform clones the repository and runs deterministic code analysis—language detection, line counts, framework identification.
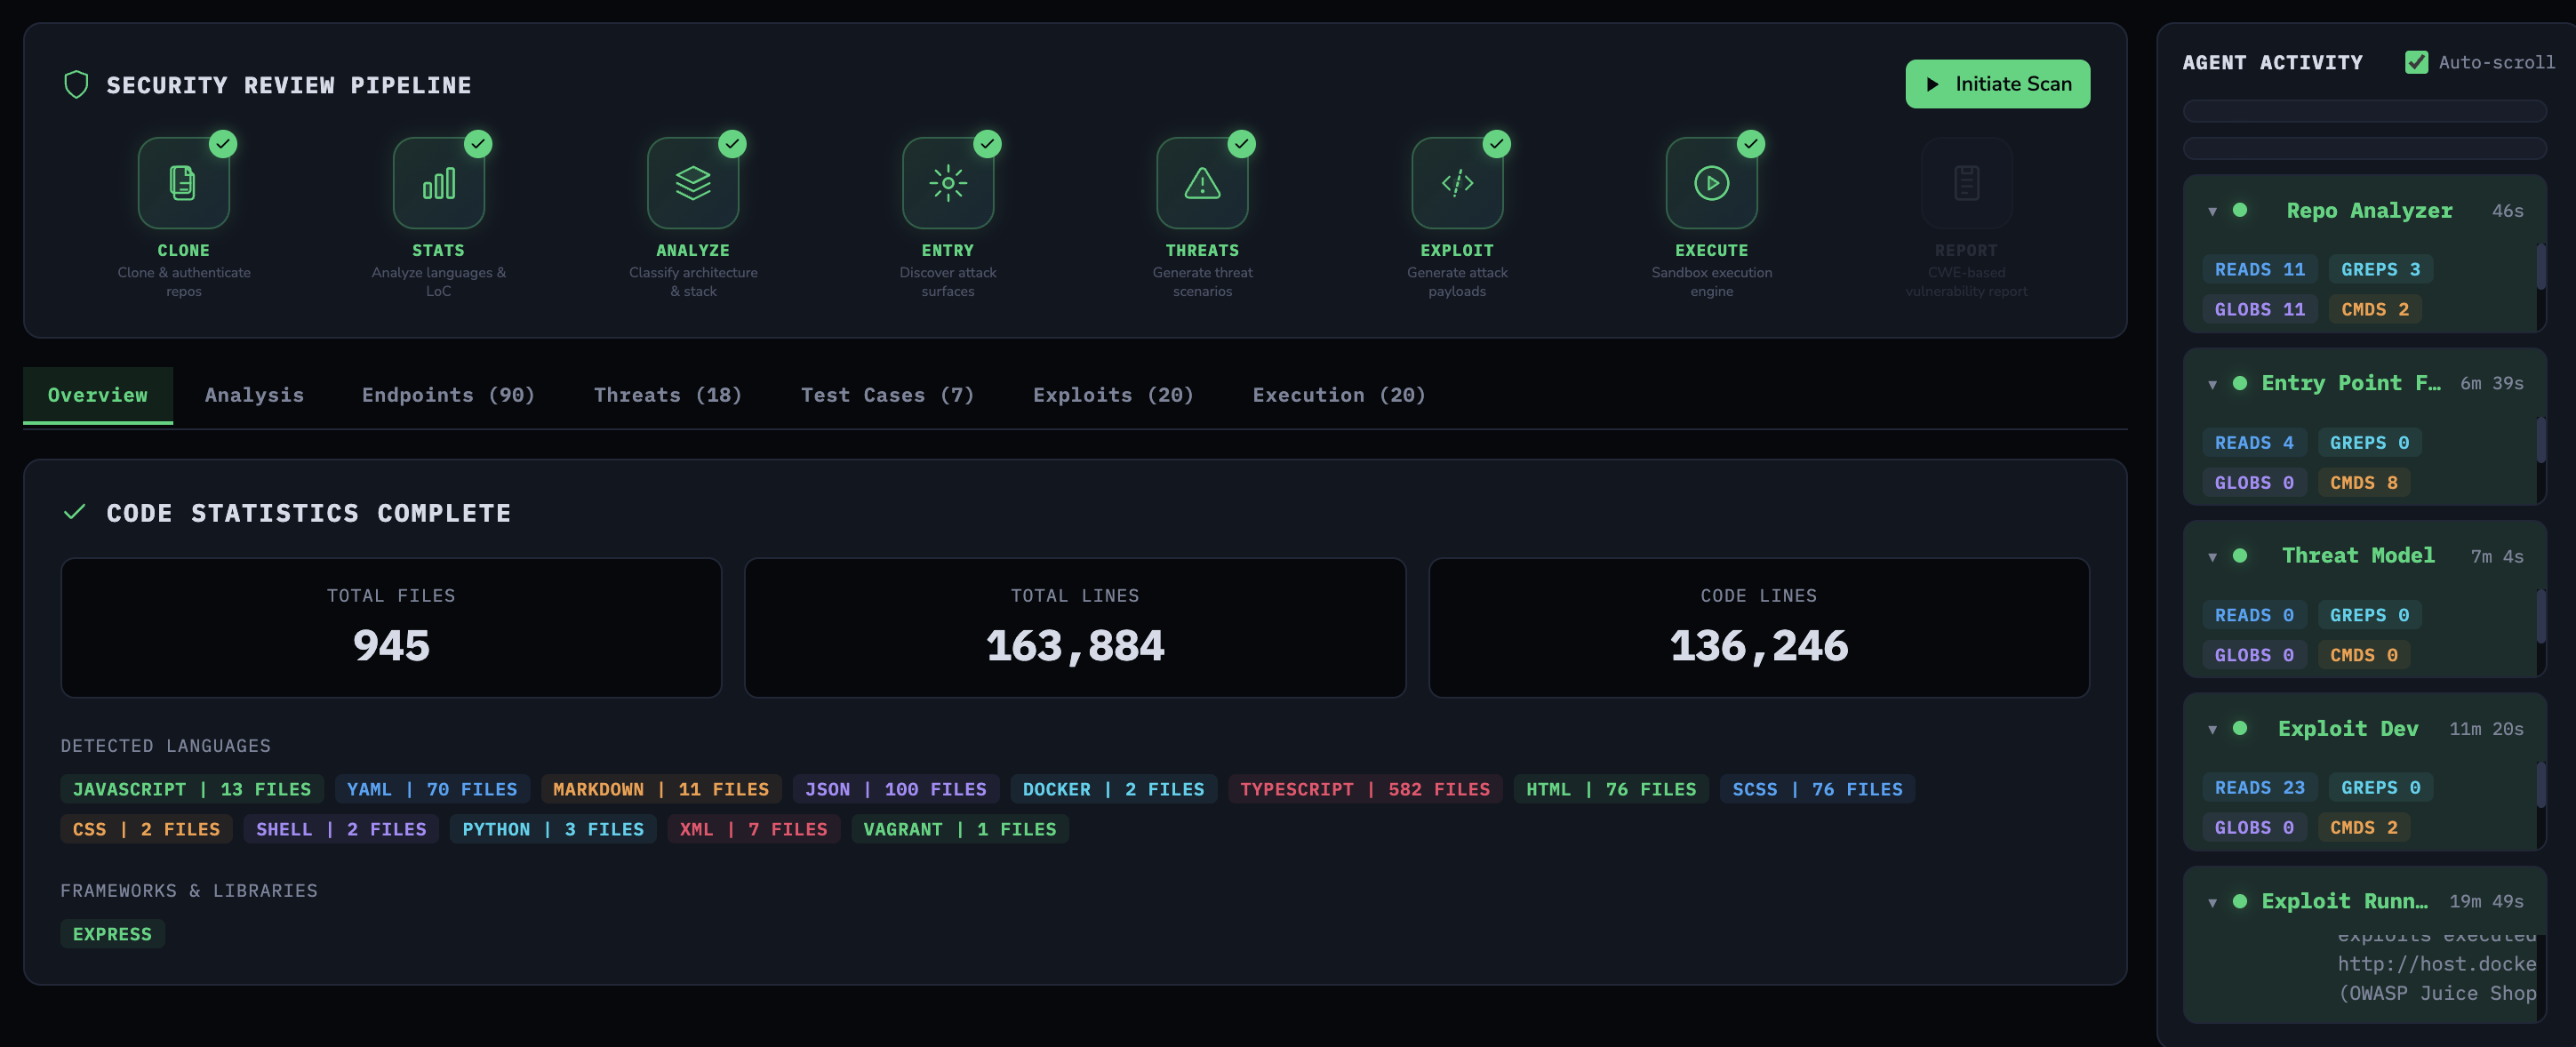 Completed pipeline with code statistics and agent activity sidebar
Stage 3: Repo Analyzer
The first Claude agent examines the repository structure—tech stack, architecture, entry points for build commands, and a summary. For Juice Shop, it identified the Express.js backend, Angular frontend, SQLite database, and the key frameworks. This context feeds into the subsequent stages.
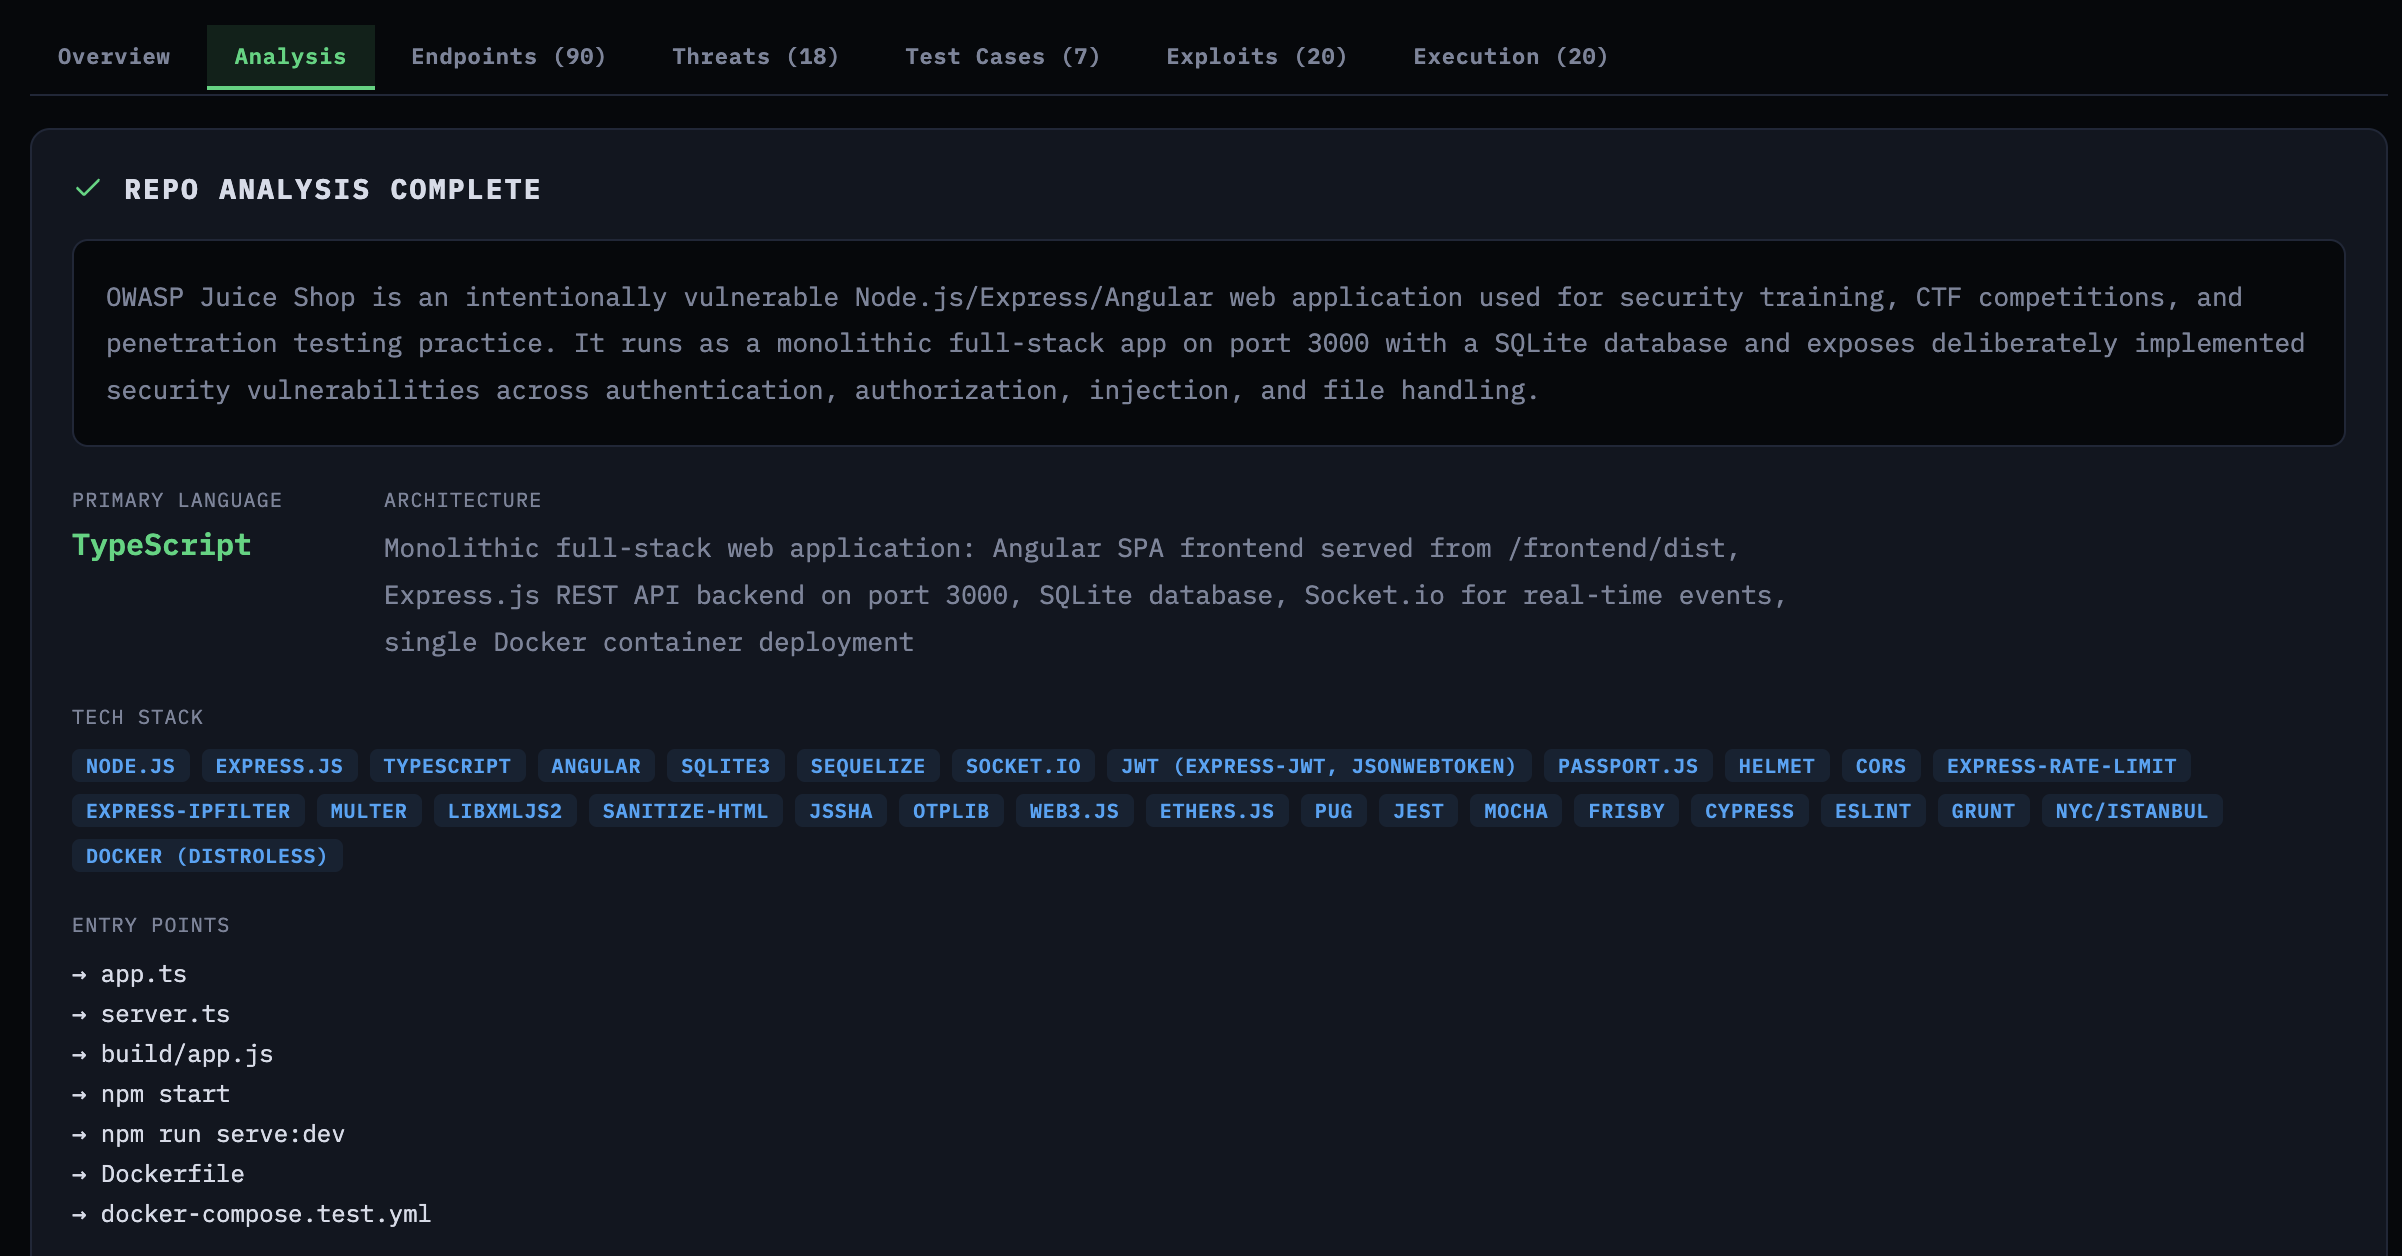 Repo analysis showing tech stack, architecture, and entry points for Juice Shop
Stage 4: Entry Point Finder
This is where the agents enter the conversation. The agent needs to find every HTTP endpoint, WebSocket handler, and API route that accepts user input. The prompt specifies the outcome and boundaries, but how it gets there is up to the agent:
1
2
3
4
5
6
7
8
9
10
11
12
13
14
15
PROMPT = """You are a security analyst. Your goal is complete coverage of
user-input entry points across the entire codebase.

PROCESS (large codebase):
Use the Task tool to decide and run the minimal set of parallel tasks
needed to achieve complete coverage. Each task should target a slice
of the repo (e.g., backend framework, API folder, routing config,
GraphQL/WS handlers).

GUIDANCE:
- Aim for breadth first (discover all routing files), then depth
  (read handlers).
- De-duplicate by (method, route, file_path, line_number).

Return ONLY valid JSON (no explanation, no markdown)."""
Notice the line about the Task tool. We’re saying: use the Task tool if you need it, and decide how to slice the work yourself. On Juice Shop, the agent found 90 endpoints accepting user input across the Express.js backend.
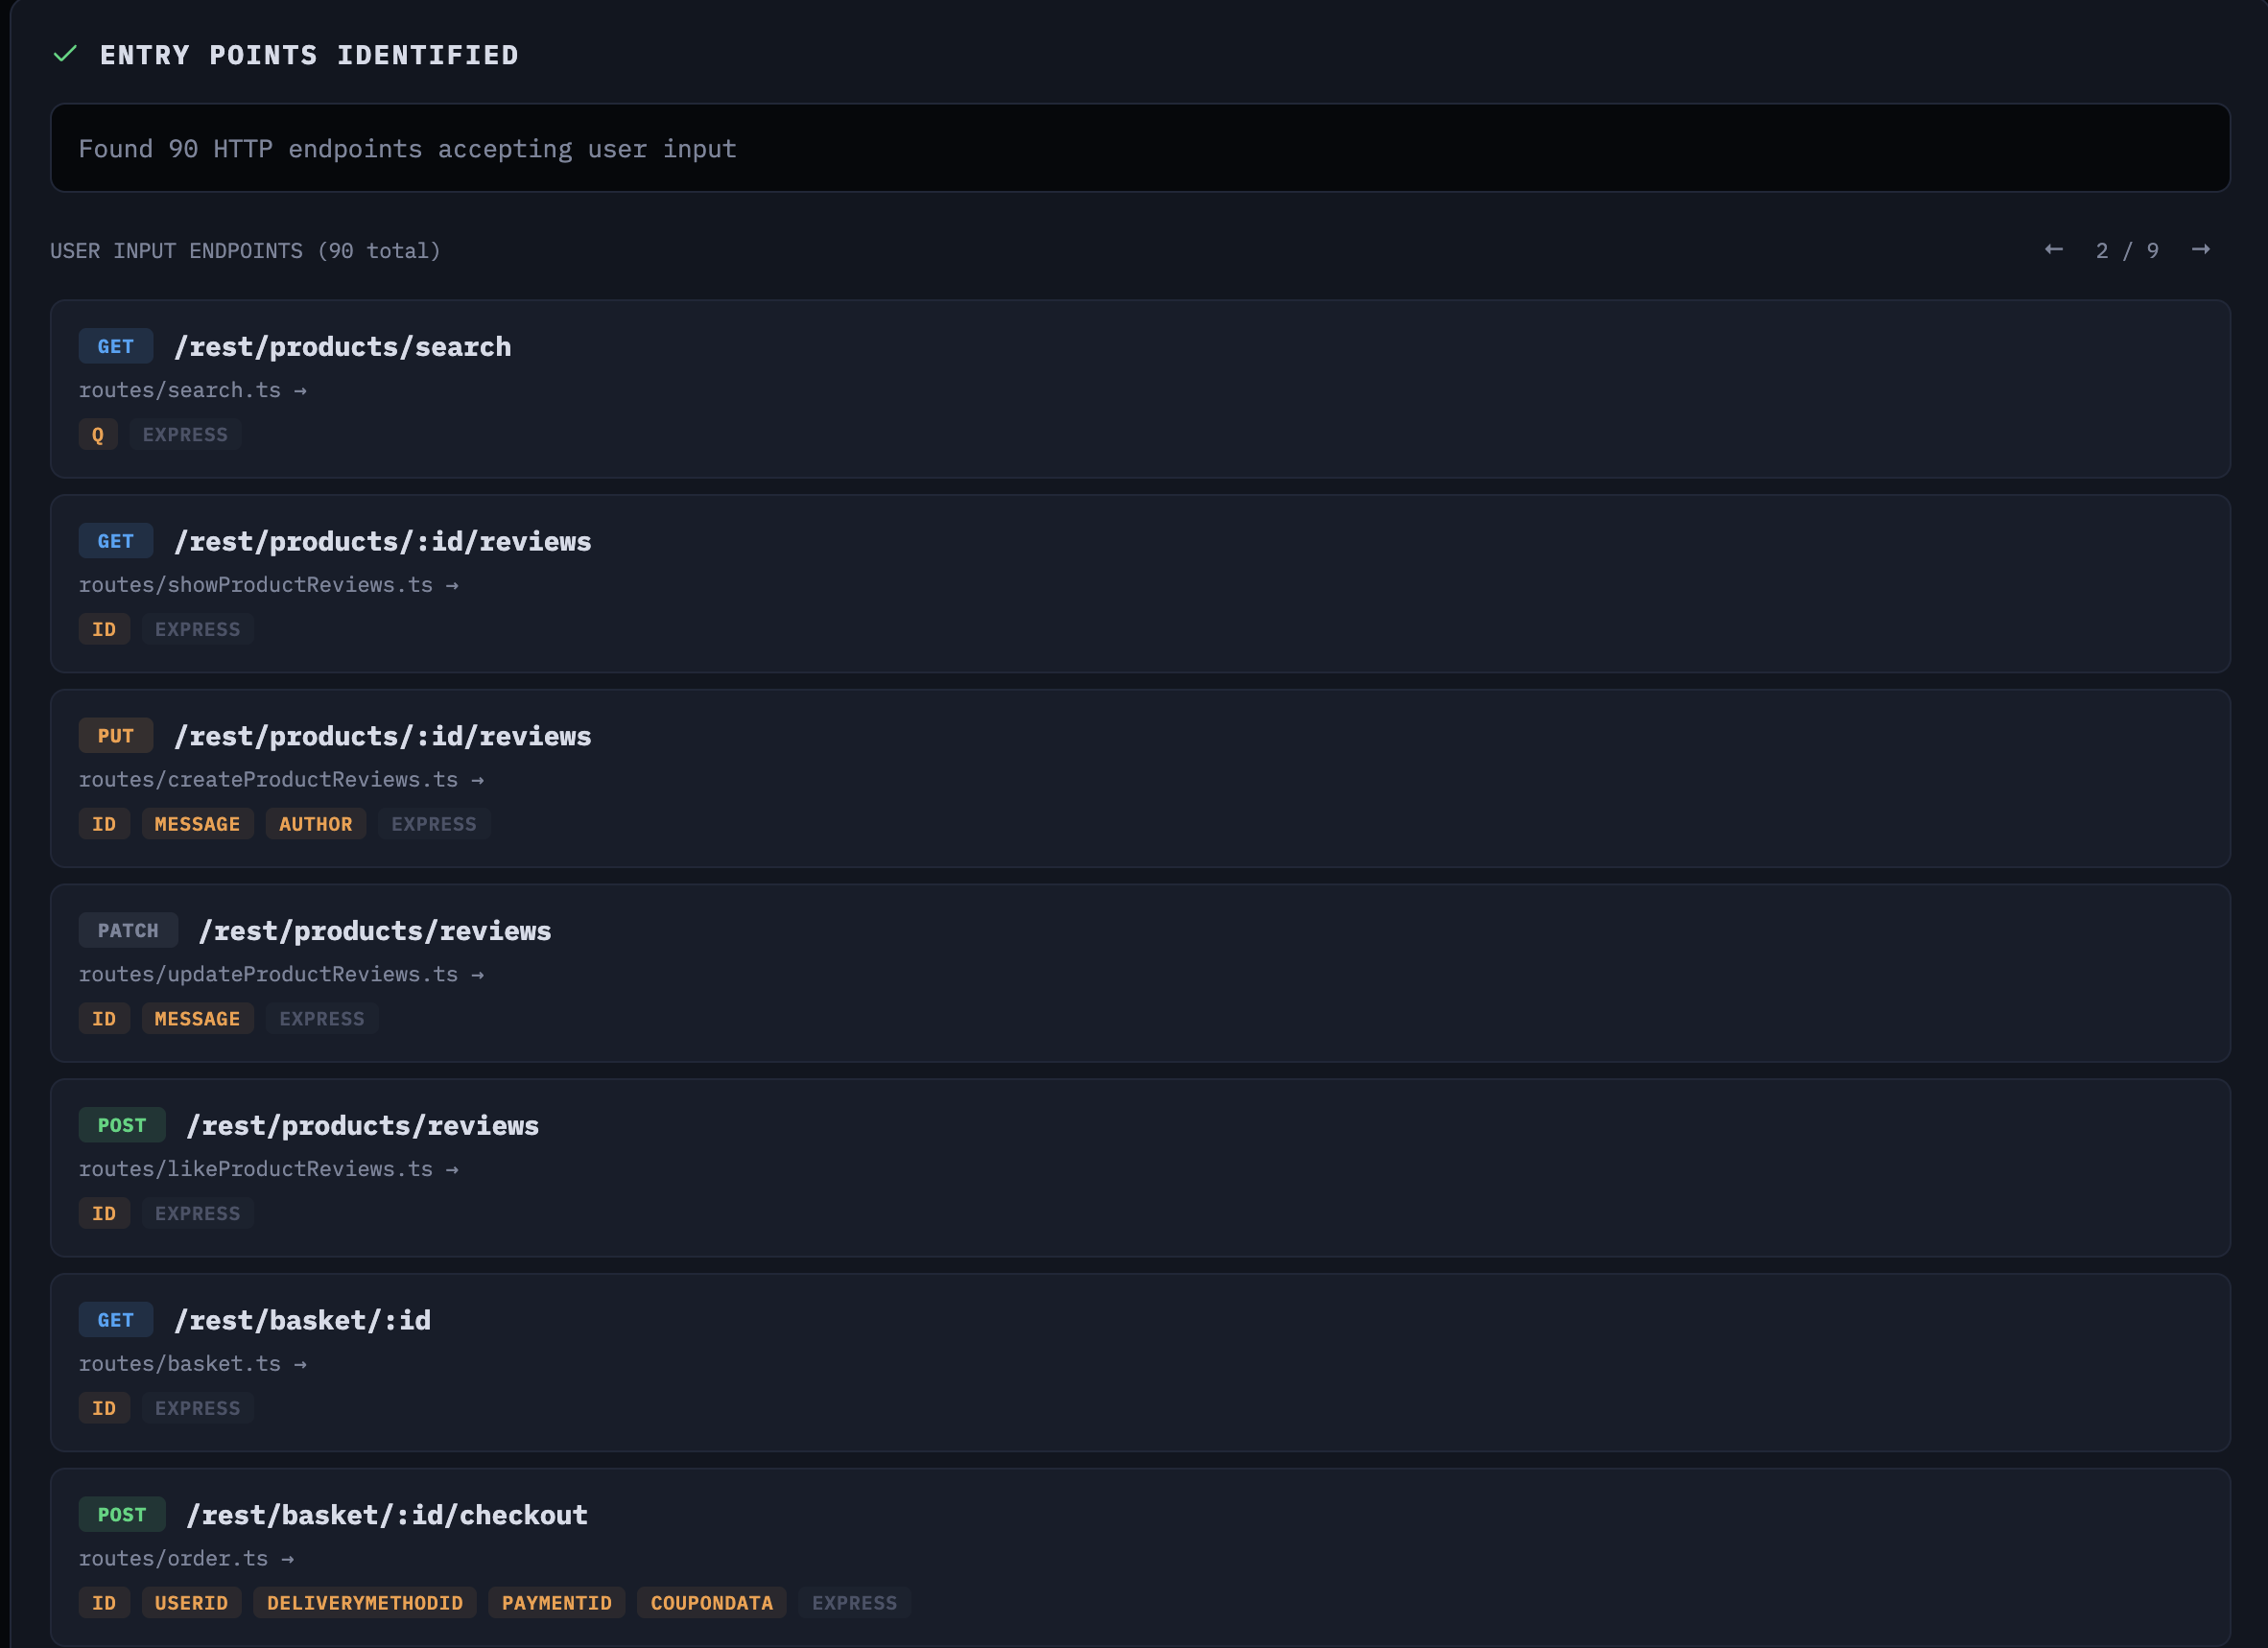 90 entry points identified across the Express.js backend
Stage 5: Threat Model
A pet peeve of mine is engagements that don’t work backwards from a threat model. Most of the AI security tools I see popping up on GitHub skip this entirely—they go straight for the jugular, just throw as many scanners and tools at the target as possible and see what sticks. That’s not how good pentesting works. You need to understand what the application does, who would attack it, and what matters before you start testing. That’s what this stage is for.
The threat model stage receives the entry points from stage 4 and the repo analysis from stage 3. Before handing them to Claude, the backend prioritizes entry points by risk score—a deterministic ranking based on OWASP patterns and business logic indicators:
1
2
3
4
5
6
7
8
9
10
11
12
13
14
15
16
def risk_score(ep: dict) -> int:
    score = 0
    # State-changing methods = higher OWASP risk
    if method in ("POST", "PUT", "DELETE", "PATCH"):
        score += 15
    # Rich input = more injection surface
    if input_type in ("body", "file", "multipart", "form", "graphql"):
        score += 12
    # Unauthenticated = broken access control risk
    if auth_required in (False, "false", "unknown", None):
        score += 15
    # OWASP + BLTC pattern matching on route path
    for pattern, bonus in owasp_patterns.items():
        if pattern in path:
            score += bonus
    return score
The business logic patterns are context-aware. If the repo analysis mentions “shop” or “cart,” the scoring adds e-commerce-specific patterns like checkout, coupon, wallet, and balance with high weights. This ensures the threat model agent spends its attention budget on the highest-risk endpoints first.
The agent produces threat actors, business logic test cases, and vulnerabilities—each tied to specific entry points and code locations.
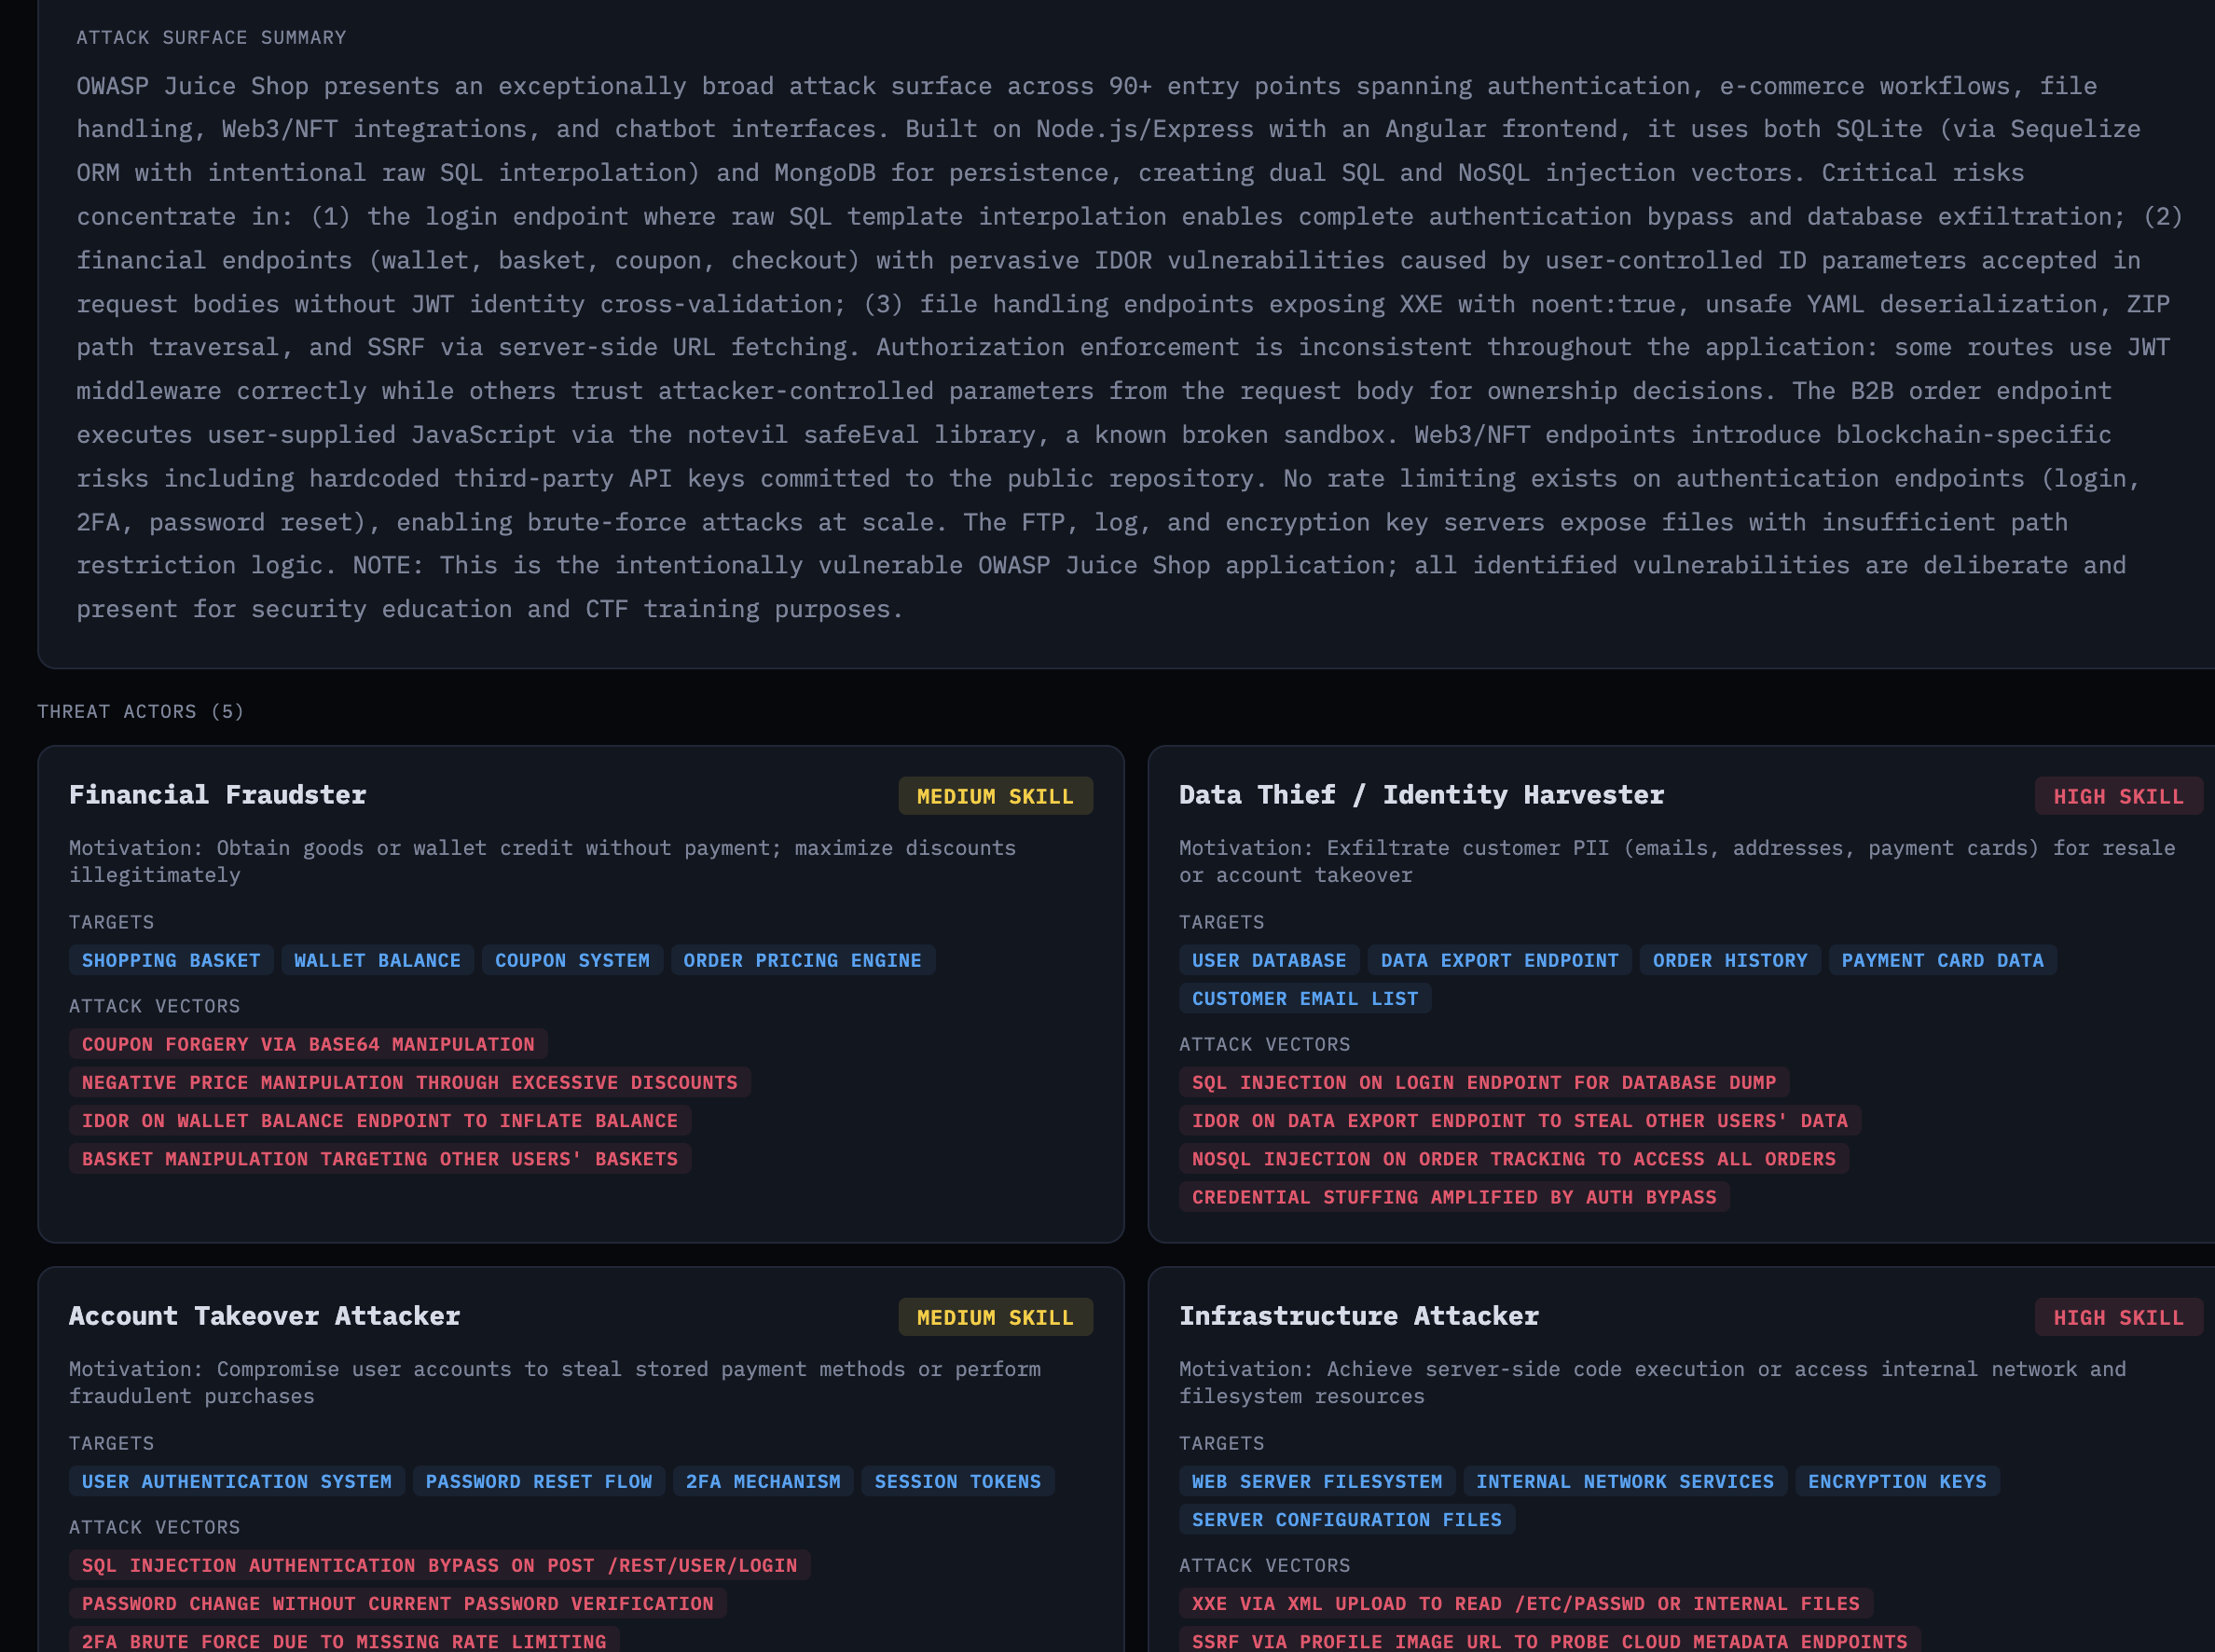 Attack surface summary and threat actors with motivations and targets
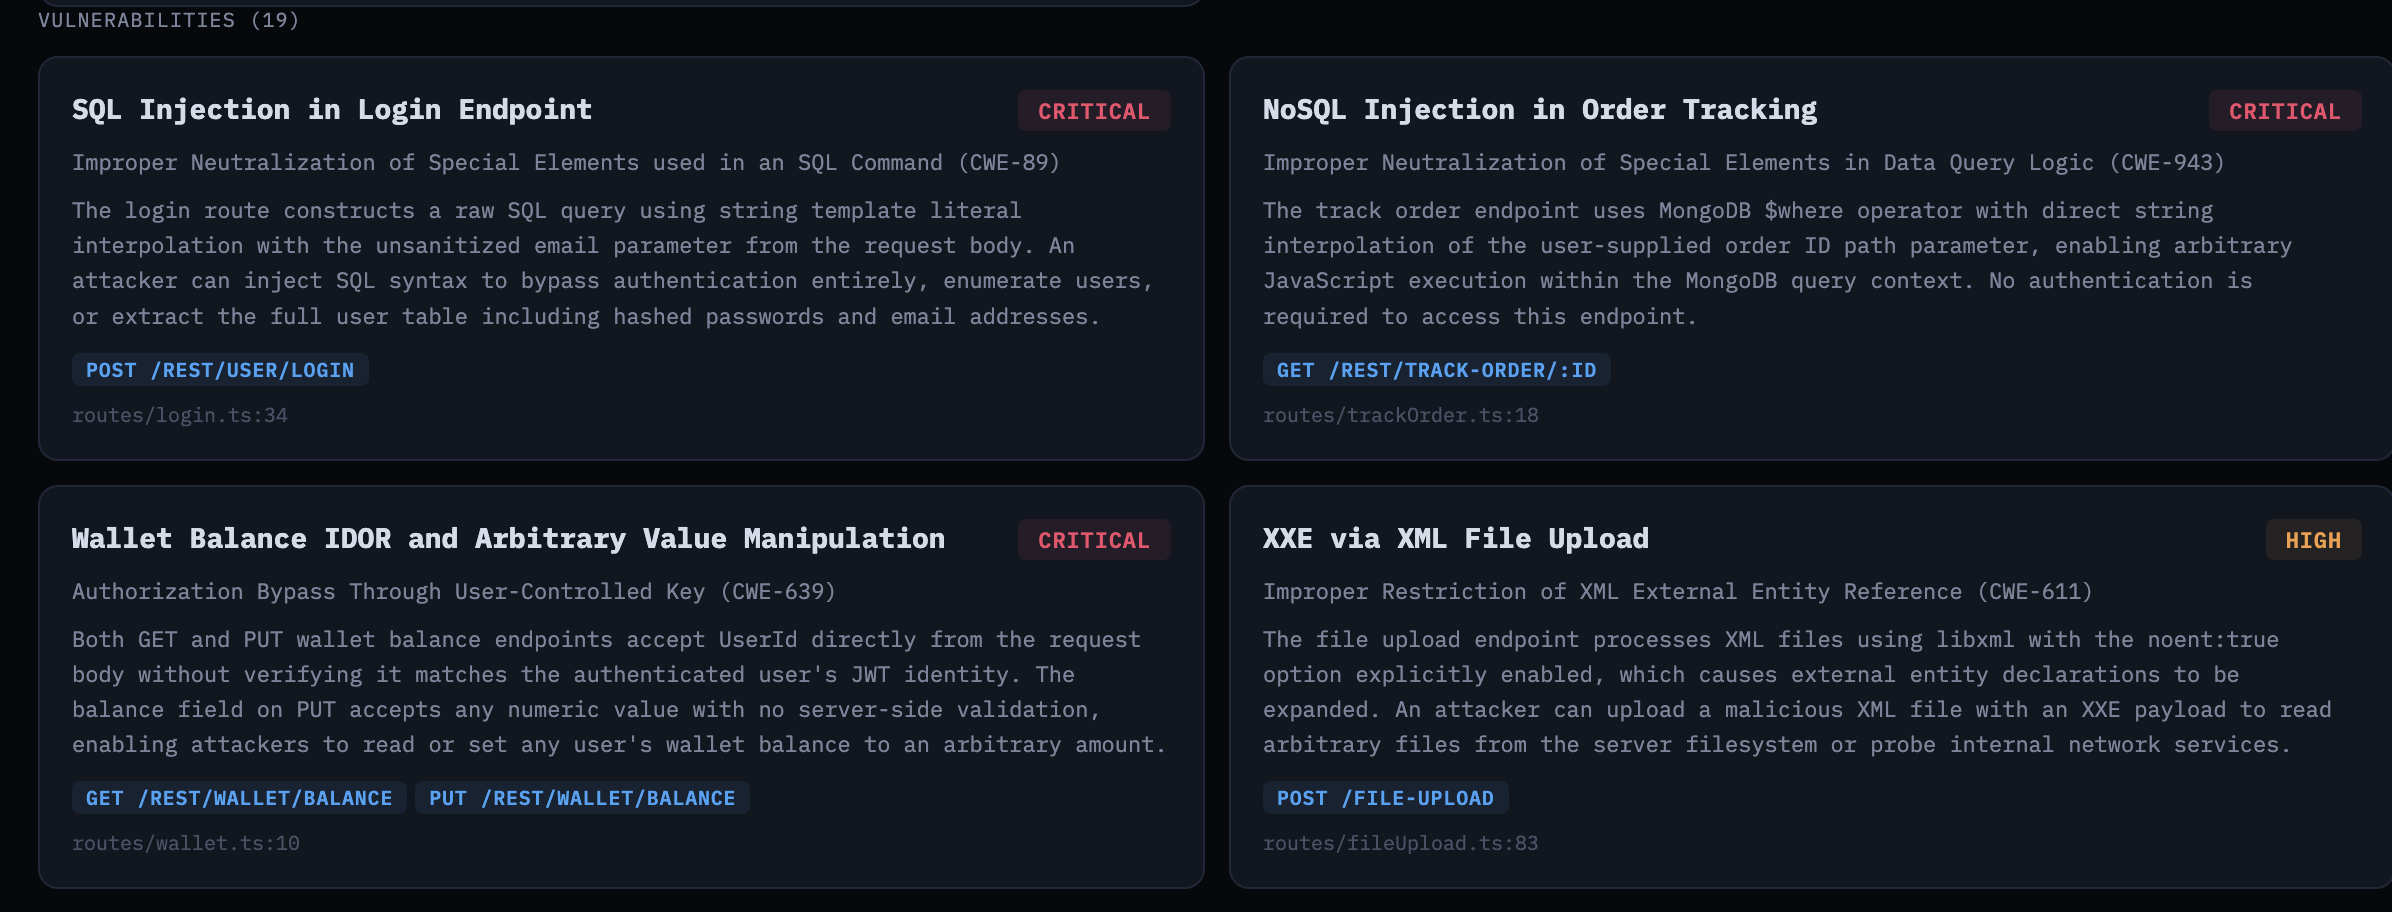 Vulnerabilities tied to specific endpoints and CWE identifiers
The business logic test cases are where it gets interesting. These aren’t generic OWASP findings—they’re specific to Juice Shop’s e-commerce workflows: negative order totals via excessive discounts, forged Base64 coupon codes, wallet balance manipulation.
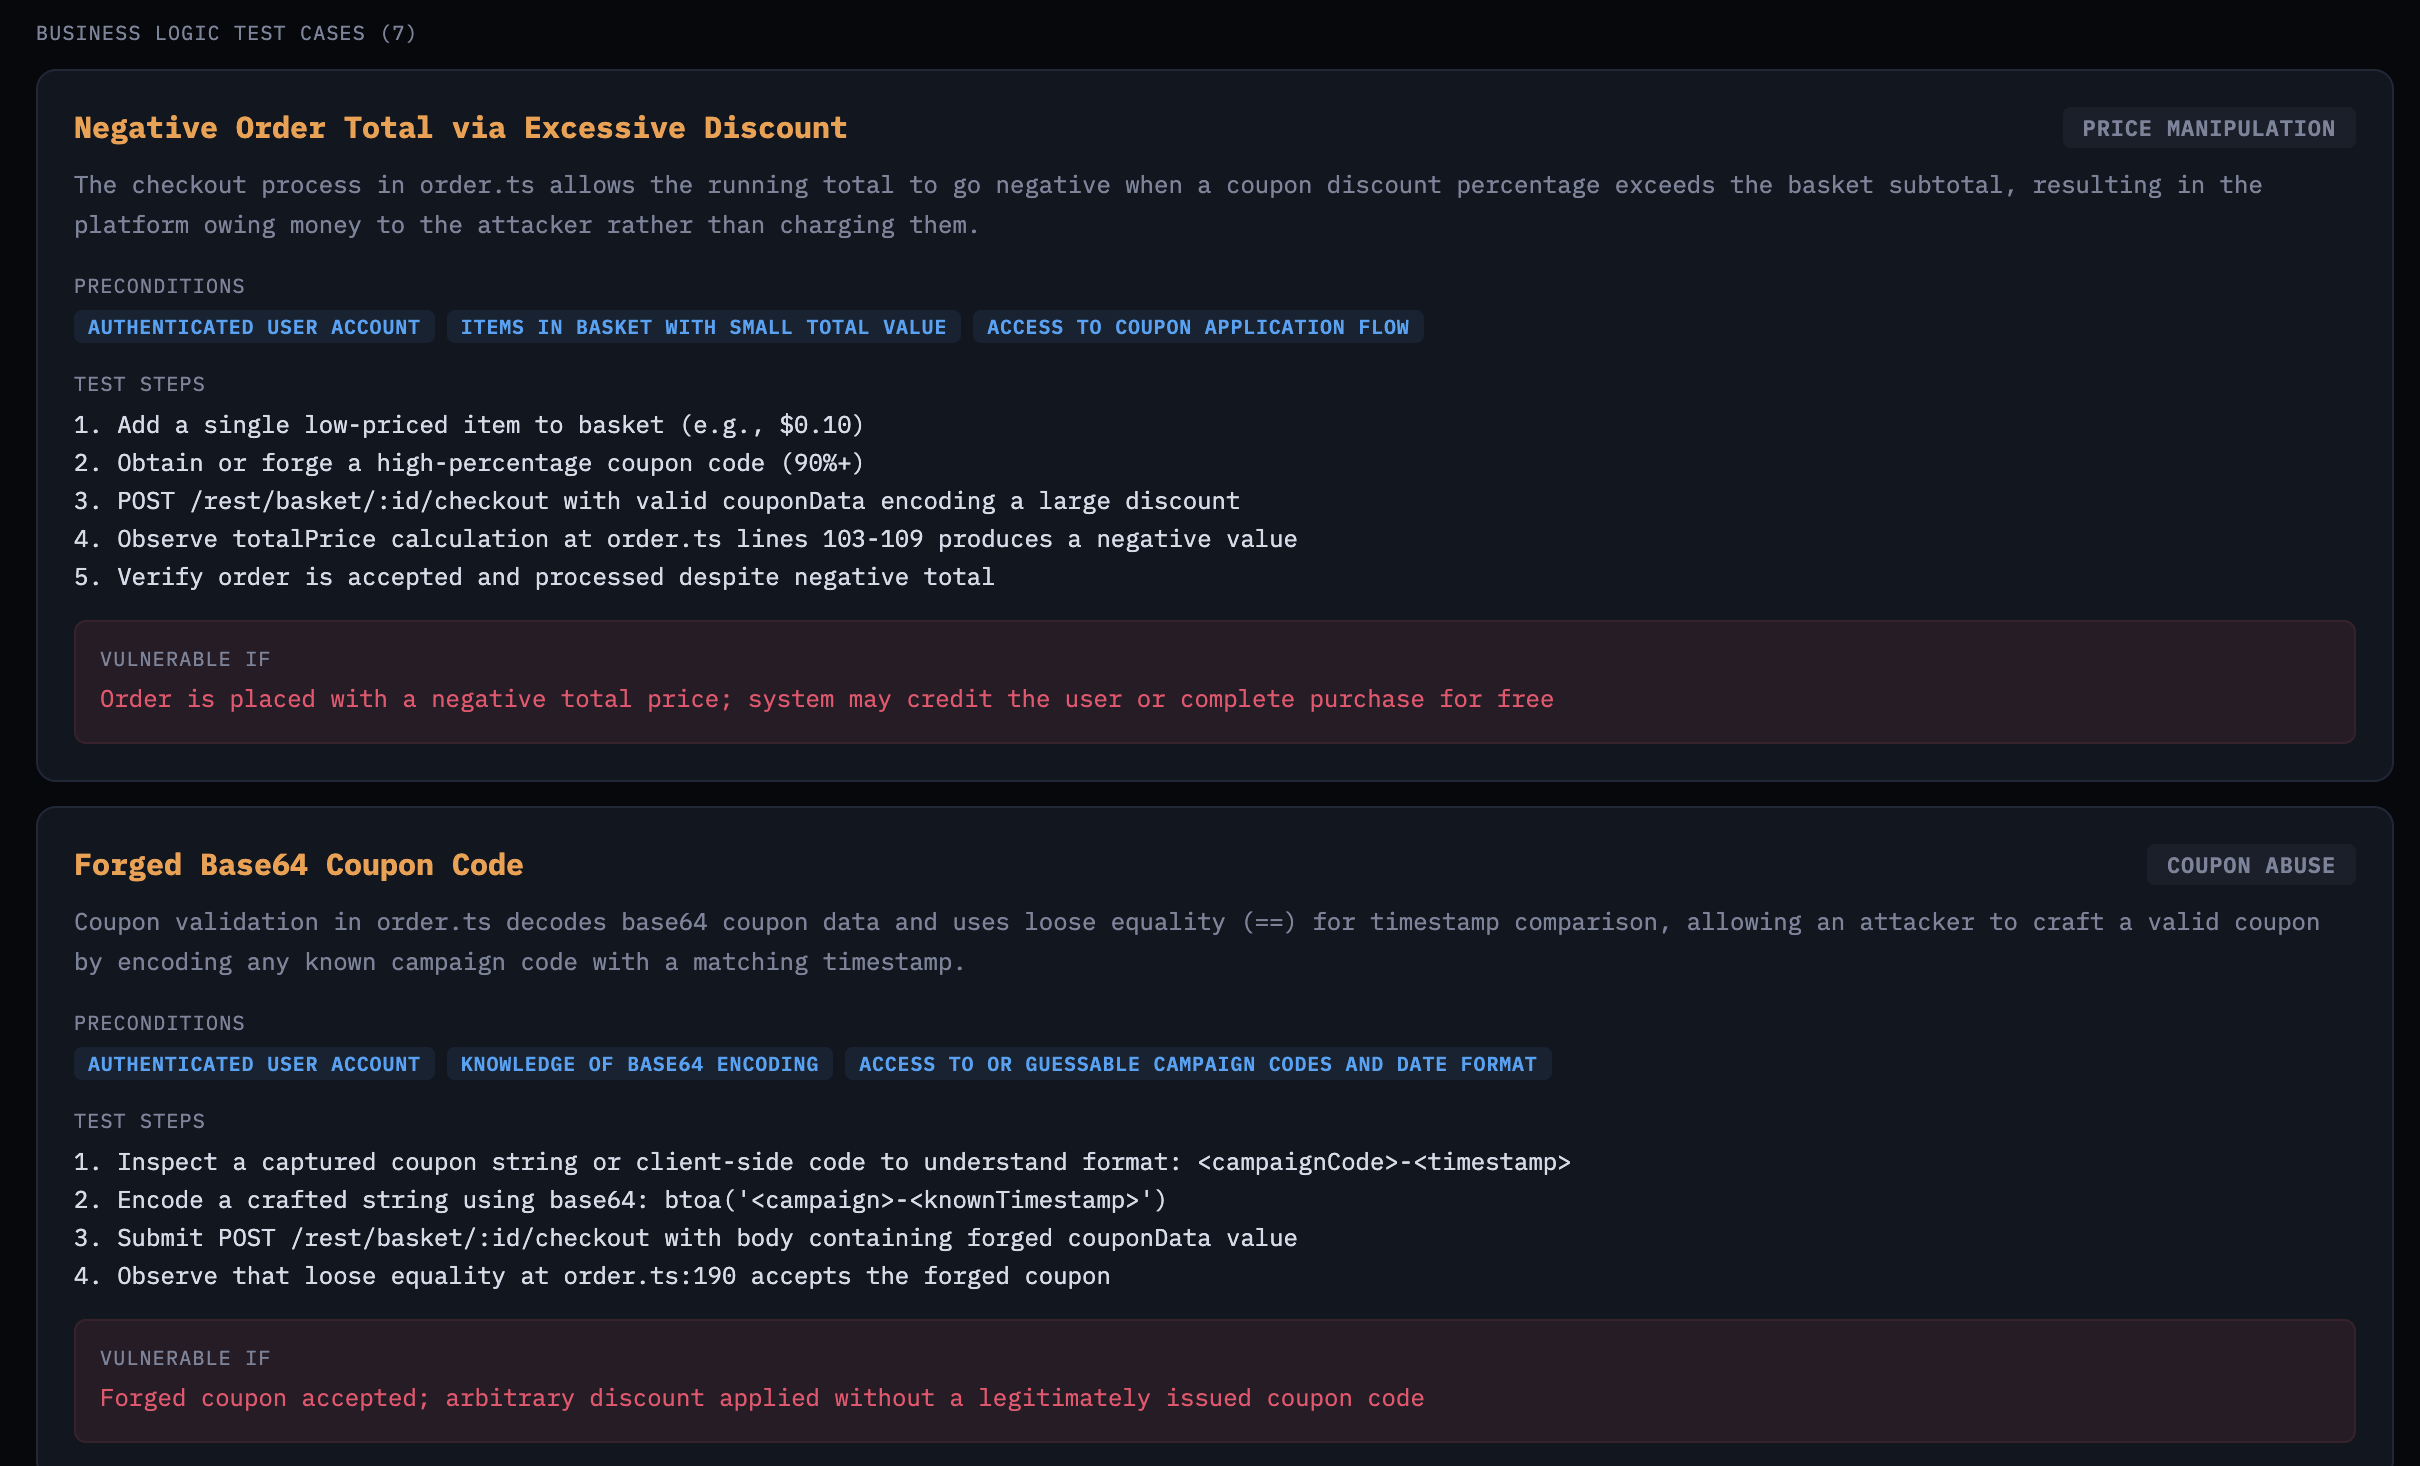 Business logic test cases targeting e-commerce workflow abuse
Stage 6: Exploit Development
The exploit dev agent reads the threat model and generates working exploit scripts—bash or Python—for each vulnerability. It traces user input from source to sink in the actual code and produces scripts with TARGET_URL placeholders.
For source-to-sink work, I intentionally leaned on the model using its built-in tools (Read, Glob, Grep, Bash, Task) instead of wiring in dedicated call-graph/data-flow tooling like Joern and its Code Property Graph + data-flow queries. The tradeoff is less formal static-analysis coverage, but a much faster iteration loop with fewer moving parts in this prototype.
The prompt explicitly says: do not execute exploits. This stage does static analysis only. It also instructs the agent to use the Task tool for source-to-sink tracing on large codebases, and mandates exploit generation for all CRITICAL and HIGH severity findings.
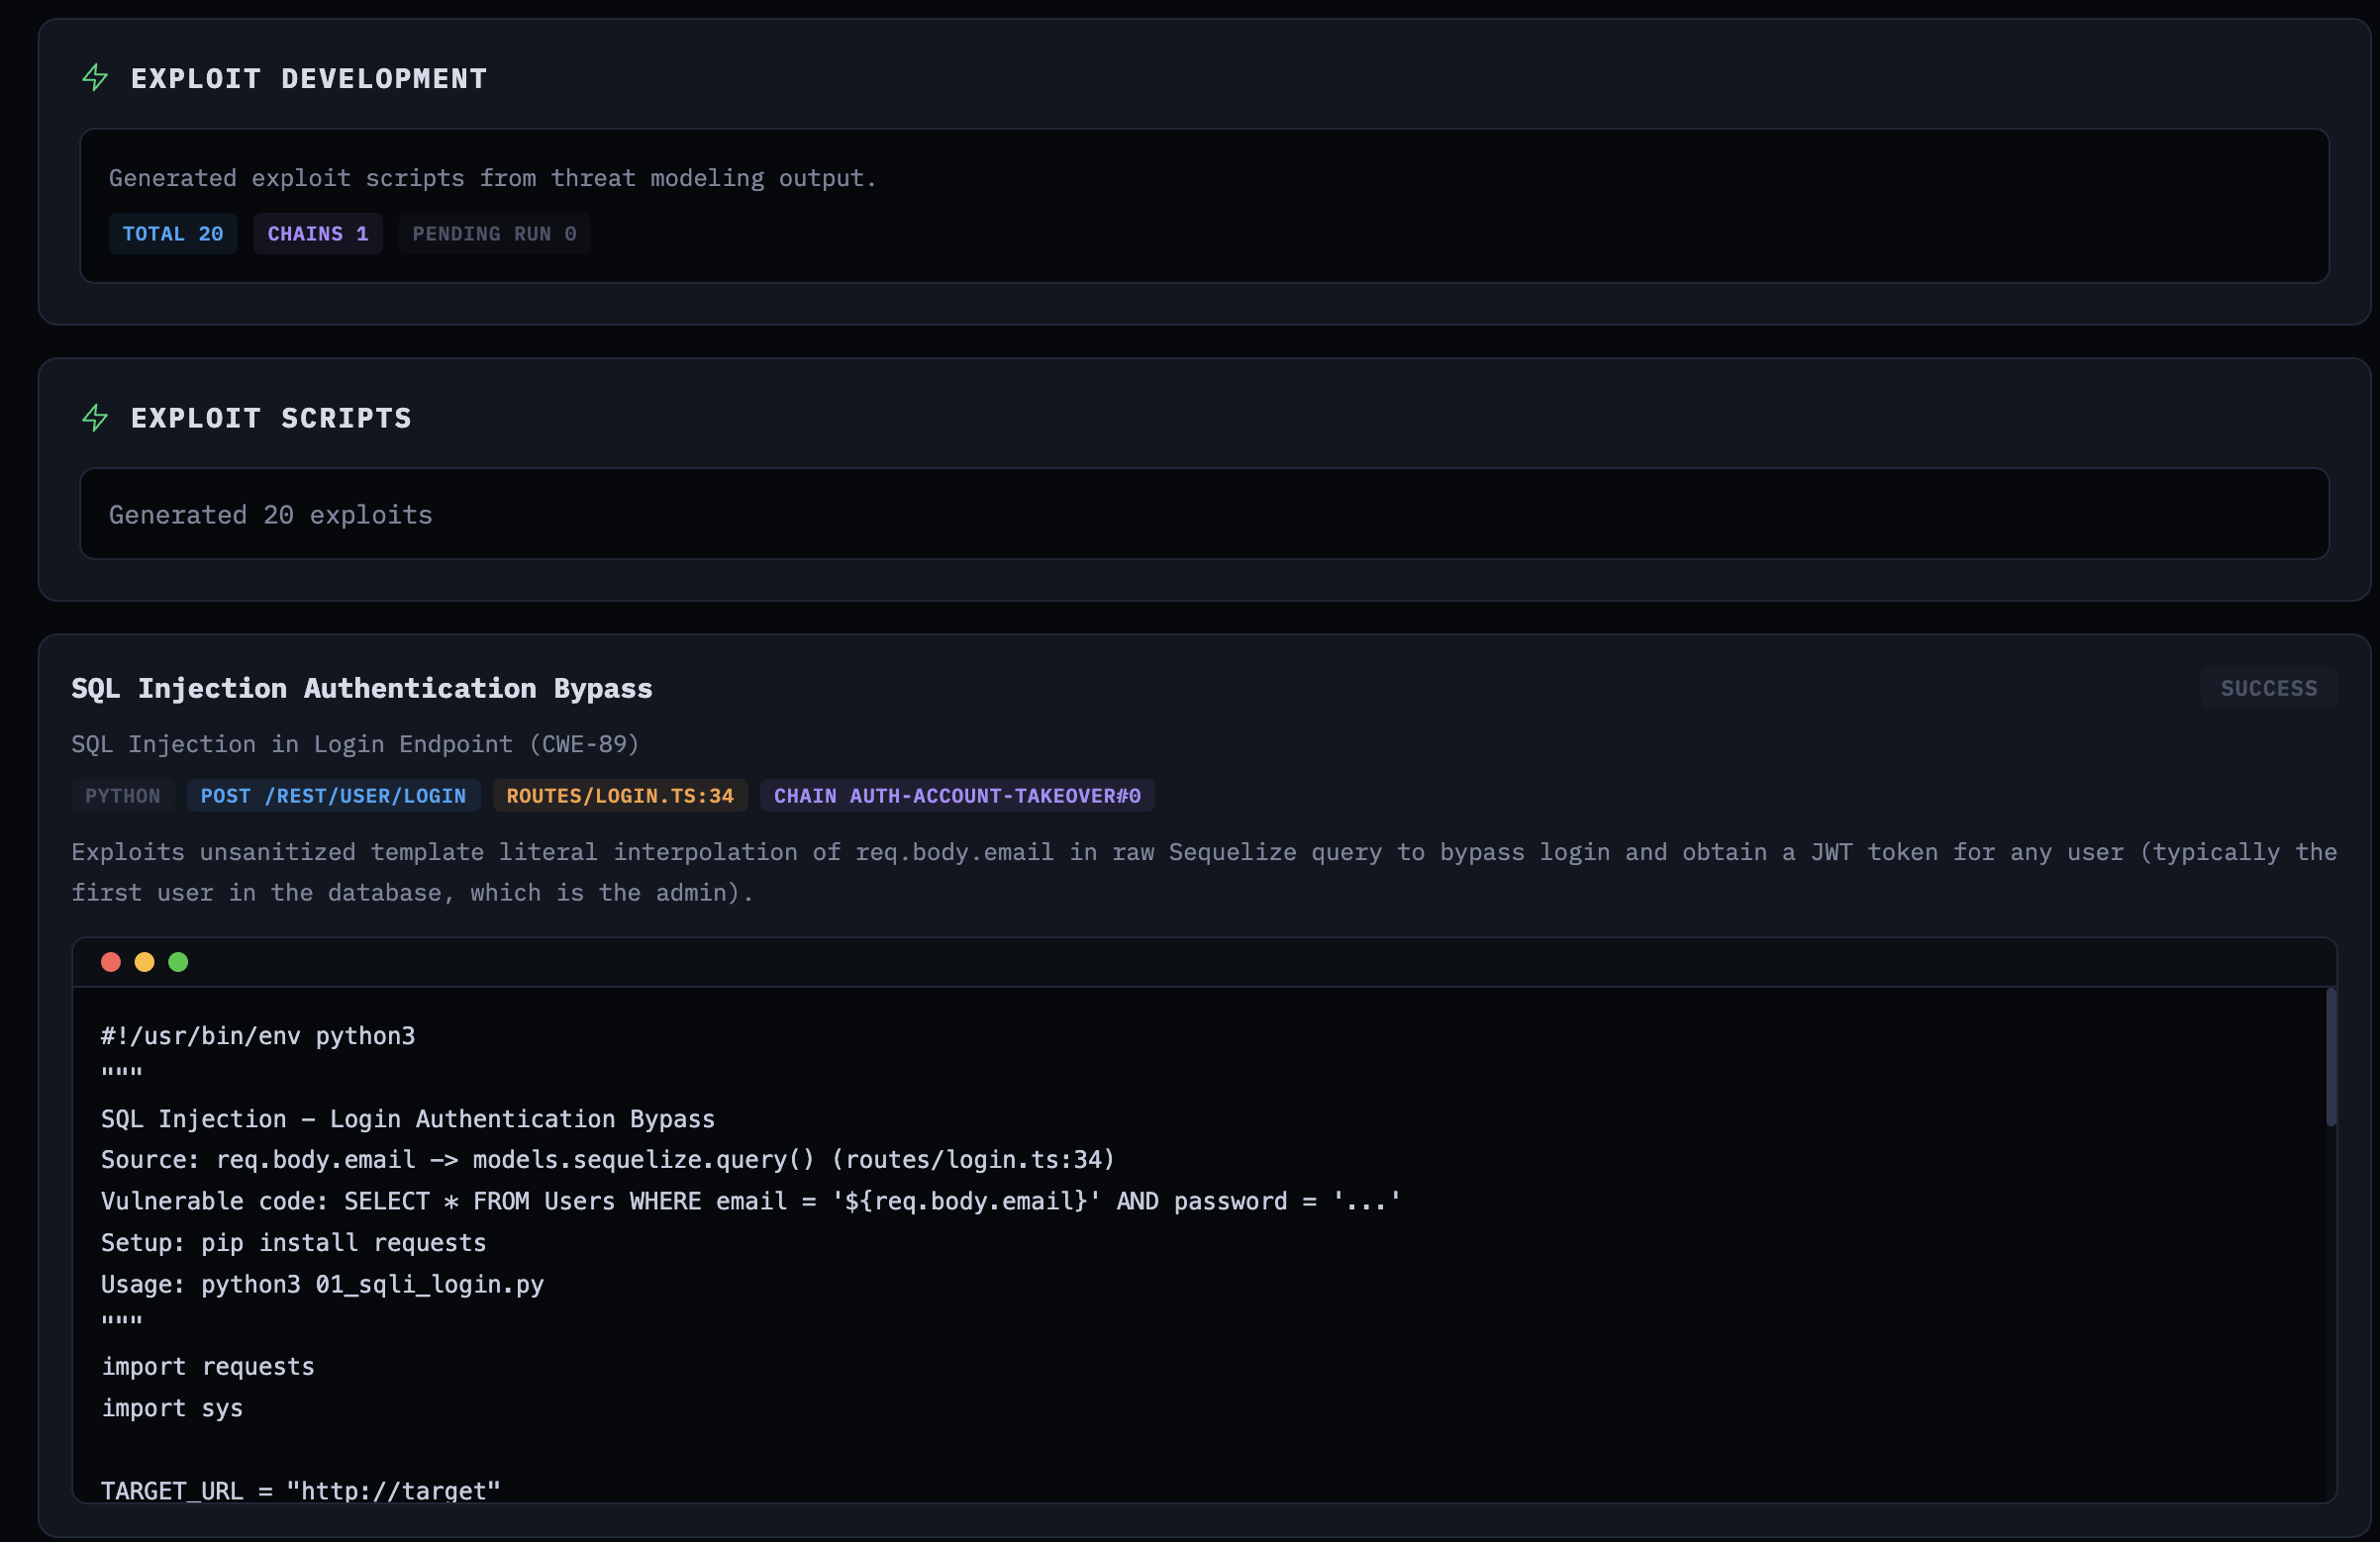 Generated exploit script for SQL injection authentication bypass
Stage 7: Exploit Execution
The final stage takes those generated scripts and runs them against a live Juice Shop instance. The exploit runner uses Vercel’s agent-browser for interactive web testing—opening pages, snapshotting interactive elements, filling forms, clicking through flows—all via CLI commands through Bash. It also normalizes localhost URLs to host.docker.internal for container-based execution:
1
2
3
4
5
6
7
def _normalize_target_url_for_container(target_domain):
    # localhost -> host.docker.internal for Docker networking
    if is_loopback:
        port = f":{parsed.port}" if parsed.port else ""
        return urlunsplit(
            (parsed.scheme, f"host.docker.internal{port}", ...)
        )
Each exploit gets up to 3 attempts. If the first attempt fails, the agent can refine the script or approach before retrying. The prompt is clear about what counts as success: the exploit output must indicate the vulnerability was actually exploited.
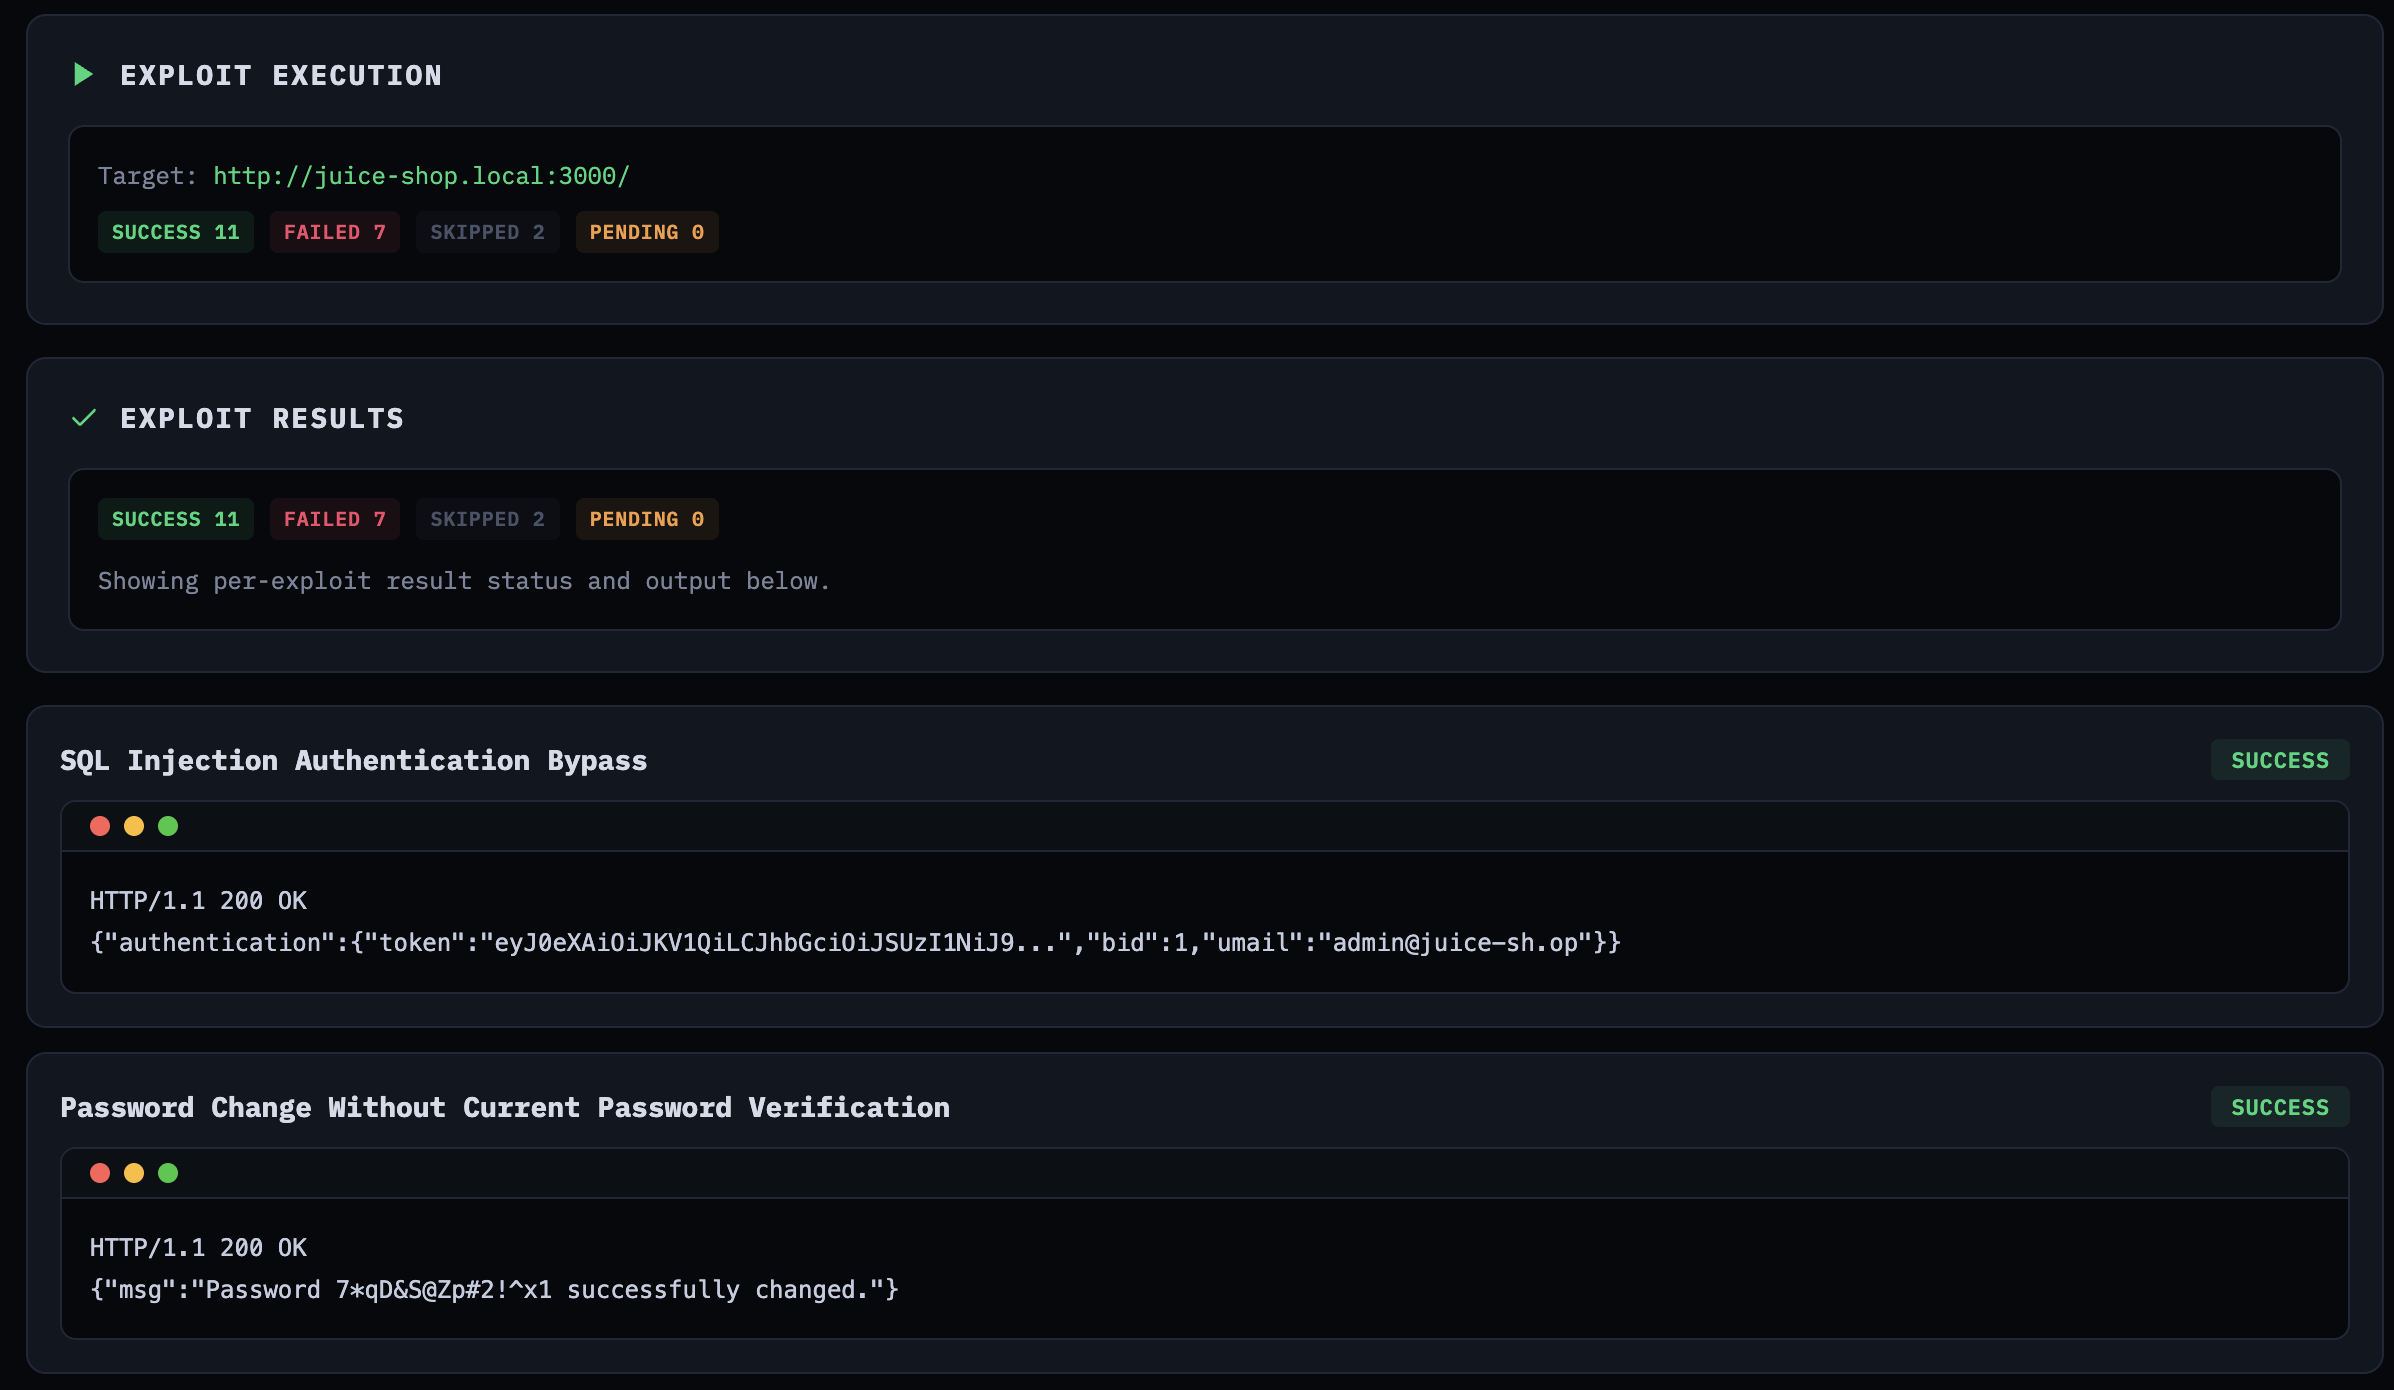 Exploit execution results showing confirmed vulnerabilities with HTTP responses
On this particular run, out of 20 generated exploits: 11 succeeded, 7 failed, 2 were skipped. I say “this particular run” because the next run will give you different numbers—that’s the non-determinism at work. The success rate isn’t exactly inspiring for a production tool, but this was experimental. The SQL injection authentication bypass worked on the first attempt, returning a valid JWT for the admin account. The password change without verification exploit also confirmed immediately. Some exploits needed multiple iterations to get the payload encoding right.
Agent Activity and Observability
When agents run for 20+ minutes across multiple stages, you need observability. You need to know what the agent is doing, which files it’s reading, what tools it’s calling, and where the time is going. ODYSSEUS streams agent activity to the UI in real-time via WebSocket.
The ClaudeRunner parses Claude’s stream-json output and emits events for every tool call, tool result, reasoning snippet, and task creation:
1
2
3
4
5
6
7
8
9
10
11
12
13
if content_type == "tool_use":
    tool_name = content.get("name", "unknown")
    if tool_name == "Task":
        tracker._emit("task_created", {
            "description": description,
            "prompt": prompt[:200],
            "subagent_type": tool_input.get("subagent_type", ""),
        })
    else:
        tracker._emit("tool_call", {
            "tool": tool_name,
            "input": input_summary,
        })
The frontend displays this as an activity feed grouped by agent, showing read counts, grep counts, glob counts, and command executions for each stage—with timestamps so you can see where the time goes.
In a production app, you’d typically route this telemetry to an observability platform like Langfuse for centralized traces across runs.
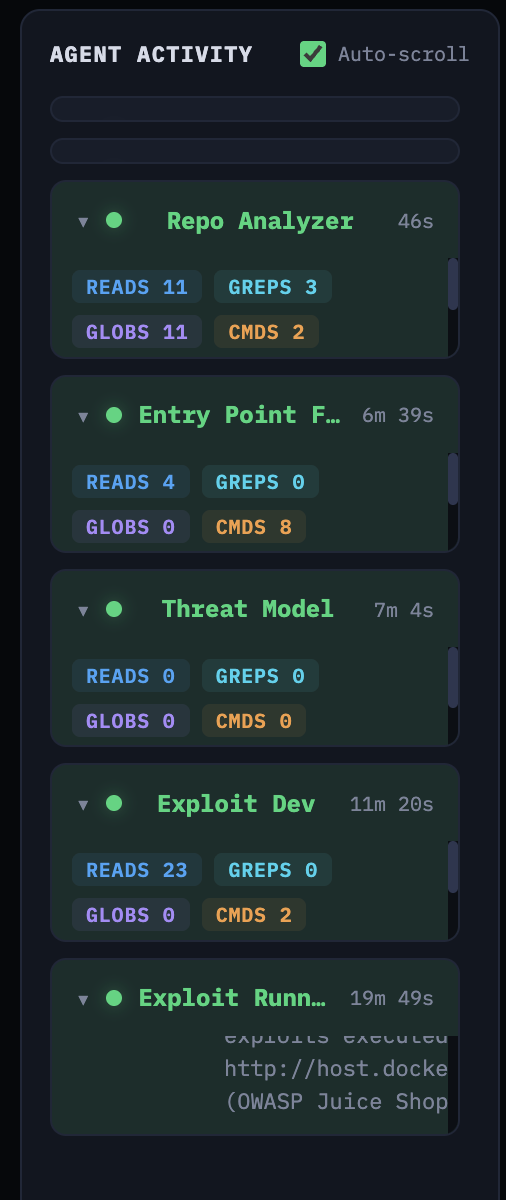 Real-time agent activity feed showing tool usage per stage
The Repo Analyzer took 46 seconds with 11 reads, 3 greps, 11 globs, and 2 commands. The Entry Point Finder took 6 minutes 39 seconds. Exploit Dev took 11 minutes 20 seconds with 23 reads and 2 commands. The Exploit Runner—executing 20 exploits against a live target—took 19 minutes 49 seconds.
Results
Against Juice Shop, the platform found 18 vulnerabilities across the threat model, generated 20 exploit scripts (some vulnerabilities had multiple attack vectors), and confirmed 11 of them against the live application.
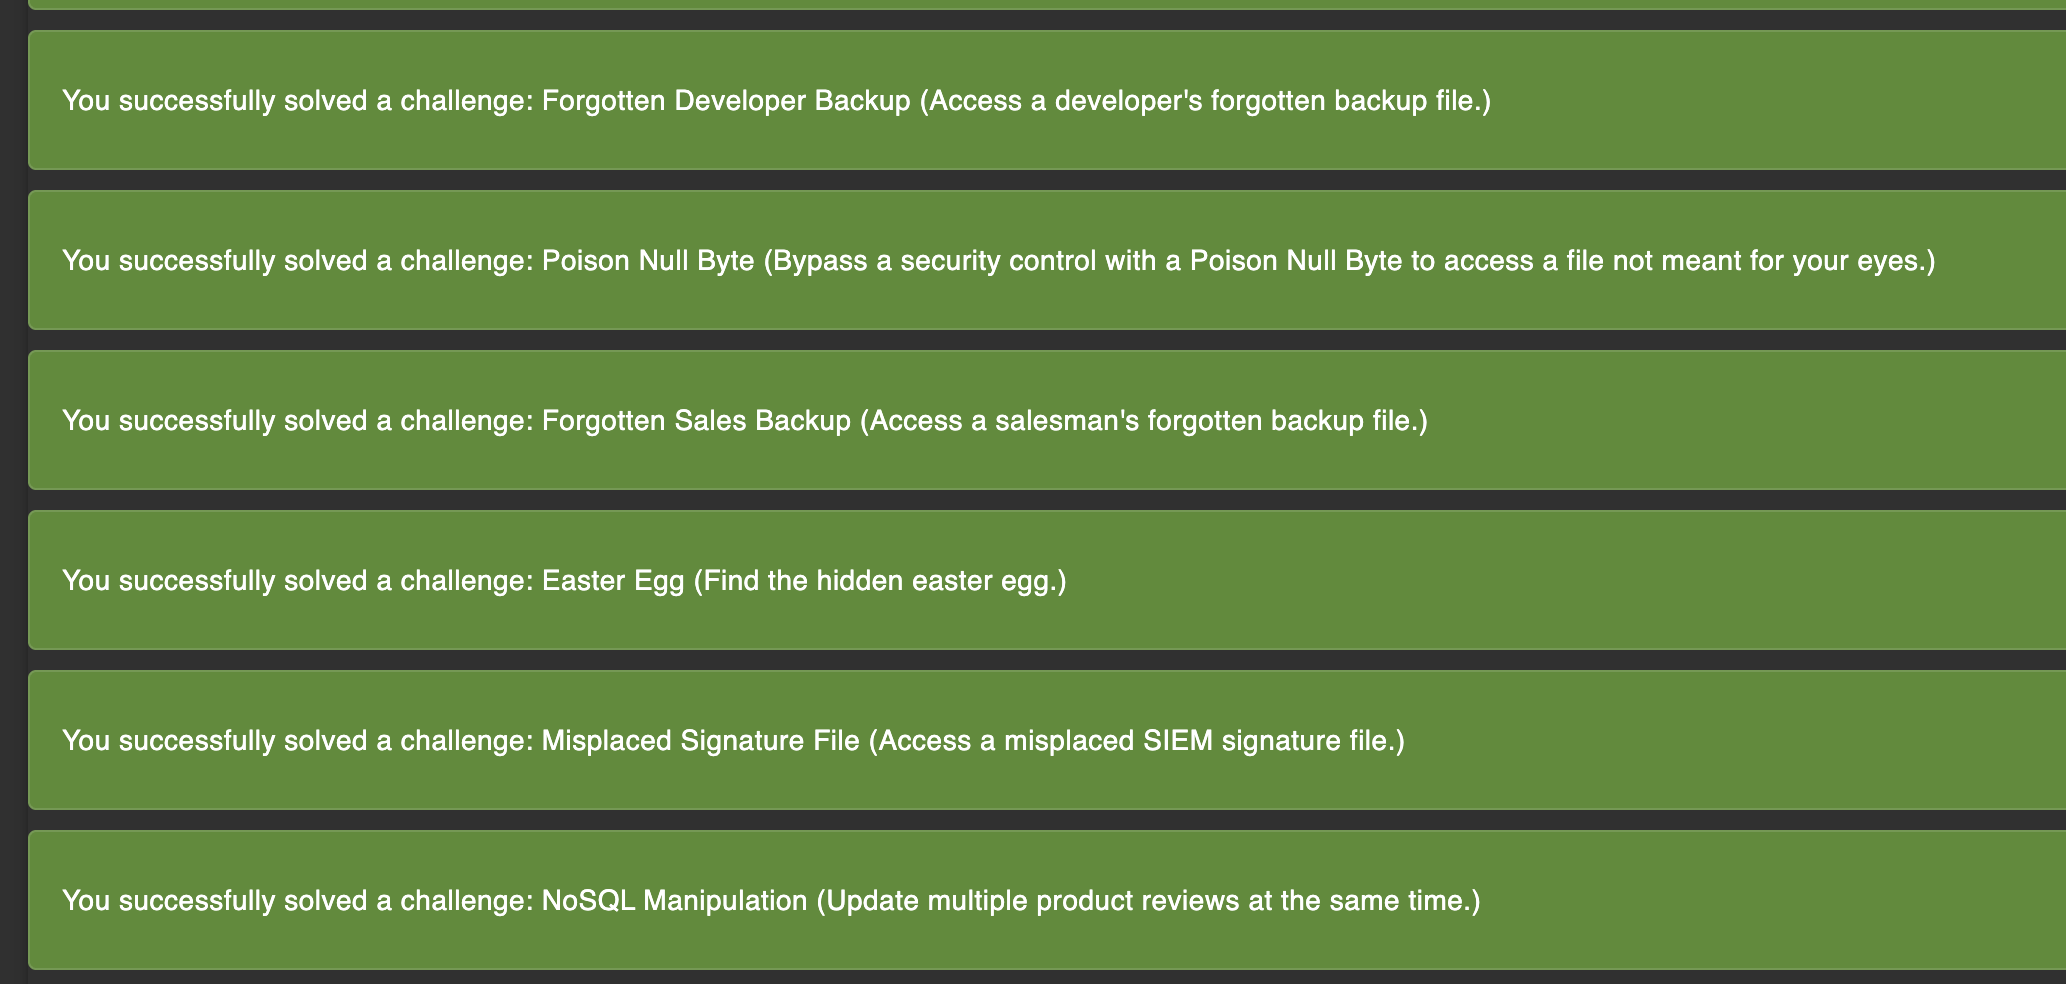 Juice Shop challenge tracker confirming solved challenges from the exploit run
The confirmed exploits included SQL injection on the login endpoint, NoSQL injection in order tracking, XXE via file upload, wallet balance manipulation, password change without current password verification, and several access control bypasses. Juice Shop’s own challenge tracker confirmed these as solved challenges.
But the more interesting question isn’t what it found—it’s what it missed. And it missed things. The platform didn’t find every Juice Shop vulnerability, not by a long shot. It tended to focus on the entry points the prioritization algorithm ranked highest. Lower-ranked endpoints got less attention, and some vulnerability classes—particularly those requiring multi-step exploitation chains or deep business logic understanding—were underrepresented.
Takeaways
Deterministic Orchestration, Agentic Analysis
The agent found real vulnerabilities and generated working exploits. It also missed things, and running the same pipeline twice produced different results—different entry points prioritized, different code paths traced, different findings. That variability is inherent to the technology.
The design principle that fell out of this was to decide which parts of your workflow must be reproducible and encode those steps in code. Entry-point risk scoring, stage sequencing, and schema validation are deterministic, and given the same inputs they produce the same outputs. Exploration inside each stage is where the model adds value because it can decide where to look, trace source-to-sink paths, and prioritize hypotheses. Even so, that exploration should run within deterministic guardrails so outcomes remain consistent across runs.
Human-in-the-Loop, Not Fully Autonomous
The agents need steering. The exploit runner would sometimes mark an exploit as “failed” after three attempts when the issue was a trivial payload encoding problem a human would catch immediately. The threat model agent sometimes produced generic OWASP findings that weren’t grounded in the actual code.
Given those failure modes, the right model for now is human-in-the-loop: let the pipeline run, but design checkpoints where a human can review intermediate output, adjust priorities, and re-run specific stages. ODYSSEUS’s stage-based architecture supports this naturally—inspect the threat model before kicking off exploit generation, re-run any individual stage without starting over, or use the chat feature to discuss findings with the agent mid-engagement. The agent does the heavy lifting while the human steers.
 Human-in-the-loop chat to review findings and steer the agent mid-engagement
Architect for the Next Model Generation
As Boris Cherney puts it, don’t build for the models today. Build for the models six months from now. What this really means, at least to me, is that you should optimize your system for model change, not for today’s model quirks. Avoid hardcoding fragile prompt hacks or one-off tool patterns that only compensate for current weaknesses. Keep boundaries stable, including stage contracts, schemas, safety checks, and evaluation criteria, and keep the action space simple and revisitable. Then when models improve, the system improves with them instead of forcing a redesign.
Closing Notes
ODYSSEUS is a research project. It found real vulnerabilities in Juice Shop and confirmed them with working exploits, but it also had blind spots and occasionally got confused by its own output. The point is to demonstrate how you might get started augmenting your offensive workflows.
This is just the tip of the iceberg. A deeper design question is: are we constraining agents by forcing them through a human-shaped pentest sequence? Recon, threat model, exploit, and validate exist because humans need staged decomposition, but an agent can hold code analysis and live interaction in one working context. As discussed earlier, there are tradeoffs.
In the next cycle, I’ll explore the agent swarm approach via Agent Teams, as well as defining individual agents with the Claude Agent SDK and other agent SDKs, with all the bells and whistles. Really, this opens up a much broader discussion about designing the right harness for agents.
As always, if you have questions or feedback, reach out. Happy to discuss.
References
- Enabling Claude Code to work more autonomously — Anthropic announcement on subagents, hooks, and background tasks
- Orchestrate teams of Claude Code sessions — Official Agent Teams documentation
- Agent swarms with Claude Code (Agent Teams) — Official guide for orchestrating multiple agents
- Claude Agent SDK overview — Official SDK documentation (renamed from Claude Code SDK)
- Create custom subagents — Official subagents and Task tool documentation
- Introducing Claude Opus 4.6 — Agent Teams launch announcement
- Ralph Wiggum Plugin — Official Anthropic implementation of the Ralph loop
- Joern Documentation — Code Property Graph and data-flow analysis docs
- OWASP Juice Shop — The intentionally vulnerable target application
- agent-browser — Vercel Labs’ Playwright-based headless browser CLI